


Ballast W
a
ter Risk Assessment
Global Ballast Water
Management Programme
G L O B A L L A S T M O N O G R A P H S E R I E S N O . 1 3
Port of Saldanha Bay
Ballast Water Risk Assessment
, Republic of South Africa
Port of Saldanha Bay
Republic of South Africa
Final Report
NOVEMBER 2003
Final Report
Adnan Awad, Chris Clarke,
.dwa.uk.com
Leticia Greyling,
Rob Hilliard, John Polglaze
GLOBALLAST MONOGRAPH SERIES NO.13
& Steve Raaymakers
More Information?
el (+44) 020 7928 5888 www
Programme Coordination Unit
Global Ballast Water Management Programme
International Maritime Organization
4 Albert Embankment
London SE1 7SR United Kingdom
Tel: +44 (0)20 7587 3247 or 3251
est & Associates, London. T
Fax: +44 (0)20 7587 3261
Web: http://globallast.imo.org
A cooperative initiative of the Global Environment Facility,
United Nations Development Programme and International Maritime Organization.
Cover designed by Daniel W


GloBallast Monograph Series No. 13
Ballast Water Risk Assessment
Port of Saldanha Bay
Republic of South Africa
November 2003
Final Report
Adnan Awad3, Chris Clarke1,Leticia Greyling2,
Rob Hilliard1, John Polglaze1 & Steve Raaymakers4
1 URS Australia Pty Ltd, Perth, Western Australia
2 National Ports Authority of South Africa, Johannesburg
3 GloBallast South Africa, Cape Town
4 Programme Coordination Unit, GEF/UNDP/IMO Global Ballast Water Management Programme, International
Maritime Organization
! International Maritime Organization
ISSN 1680-3078
Published in April 2004 by the
Programme Coordination Unit
Global Ballast Water Management Programme
International Maritime Organization
4 Albert Embankment, London SE1 7SR, UK
Tel +44 (0)20 7587 3251
Fax +44 (0)20 7587 3261
Email sraaymak@imo.org
Web http://globallast.imo.org
The correct citation of this report is:
Awad, A., Clarke, C., Greyling, L., Hilliard, R., Polglaze & Raaymakers, S. 2004. Ballast Water Risk Assessment, Port of
Saldanha Bay, Republic of South Africa, November 2003: Final Report. GloBallast Monograph Series No. 13. IMO London.
The Global Ballast Water Management Programme (GloBallast) is a cooperative initiative of the Global Environment Facility (GEF),
United Nations Development Programme (UNDP) and International Maritime Organization (IMO) to assist developing countries to reduce
the transfer of harmful organisms in ships' ballast water.
The GloBallast Monograph Series is published to disseminate information about and results from the programme, as part of the
programme's global information clearing-house functions.
The opinions expressed in this document are not necessarily those of GEF, UNDP or IMO.


Ballast Water Risk Assessment, Port of Saldanha Bay, Republic of South Africa, November 2003: Final Report
Acknowledgements
The Ballast Water Risk Assessment for the Port of Saldanha Bay was undertaken during 2002 and
funded by the GEF/UNDP/IMO Global Ballast Water Management Programme and the Government
of the Republic of South Africa. The study team (Appendix 2) thanks the following for their help and
assistance:
Mr Jimmy Norman
National Ports Authority of South Africa, Port of Saldanha Bay, Saldanha.
Mr Colin Archibald
CSIR, Durban.
Dr Alan Connell
CSIR, Durban.
Dr Pedro Monteiro
CSIR, Durban.
Professor John Bolton
University of Cape Town, Cape Town.
Professor George Branch University of Cape Town, Cape Town.
Professor Charlie Griffiths University of Cape Town, Cape Town.
Professor Phil Hockey
Percy Fitz-Patrick Institute, University of Cape Town, Cape Town.
Dr Kim Prochzka
International Ocean Institute, University of Western Cape, Cape Town.
Dr Mark Gibbons
University of Western Cape, Cape Town.
Dr Derek Keiths
University of Western Cape, Cape Town.
Professor Guy Bates
Institute of Environmental and Coastal Management, Port Elizabeth
Dr Janine Adams
Institute of Environmental and Coastal Management, Port Elizabeth
Dr Michael Knight
Science Centre, South Africa National Parks, Pretoria.
Dr Grant Pitcher
Marine & Coastal Management Division, Department of Environmental
Affairs and Tourism, Cape Town.
Dr Hans Verheye
Marine & Coastal Management Division, Department of Environmental
Affairs and Tourism, Cape Town.
Ms Susan Taljaard
CSIR Environmentek, Stellenbosch.
Dr Gustaaf Hallegraeff
University of Tasmania, Hobart, Tasmania.
Dr Keith Hayes
CSIRO Marine Research, Hobart, Tasmania.
Dr Chad Hewitt
Biosecurity Unit, New Zealand Ministry of Fisheries, Auckland.
Dr Fred Wells
Western Australian Museum, Perth, Western Australia.
The report was formatted and prepared for print by Leonard Webster.
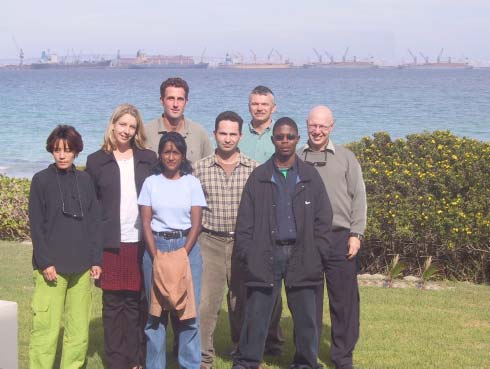
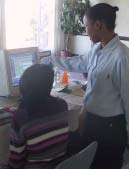
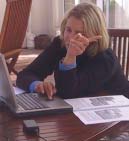
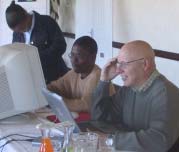
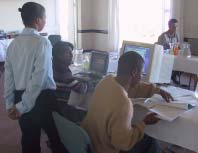
Some of the GloBallast - South Africa risk assessment team in action
i
Ballast Water Risk Assessment, Port of Saldanha Bay, Republic of South Africa, November 2003: Final Report
Acronyms
BW
Ballast water
BWM
Ballast water management
BWRA
Ballast Water Risk Assessment
BWRF
Ballast Water Reporting Form (the standard IMO BWRF is shown in Appendix 1)
CFP
Country Focal Point (of the GloBallast Programme in each Pilot Country)
CFP/A
Country Focal Point Assistant
CRIMP
Centre for Research on Introduced Marine Pests (now part of CSIRO Marine
Research, Hobart, Tasmania)
CSIR
Centre for Scientific and Industrial Research (South Africa)
CSIRO
Commonwealth Scientific and Industrial Research Organisation (Australia)
DEAT
Department of Environmental Affairs and Tourism (South Africa)
DSS
Decision support system (for BW management)
DWT
Deadweight tonnage (typically reported in metric tonnes)
GIS
Geographic information system
GISP
Global Invasive Species Programme
GloBallast
GEF/UNDP/IMO Global Ballast Water Management Programme
GT
Gross tonnage (usually recorded in metric tonnes)
GUI
Graphic User Interface
IALA
International Association of Lighthouse Authorities
IBSS
Institute of Biology of the Southern Seas (Odessa Branch) of the Ukraine National
Academy of Science
IHO
International Hydrographic Organization
IMO
International Maritime Organization
IUCN
The World Conservation Union
LAT
Lowest Astronomical Tide
MESA
Multivariate environmental similarity analysis
MEPC
Marine Environment Protection Committee (of the IMO)
NEMISIS
National Estuarine & Marine Invasive Species Information System (managed by
SERC)
NIMPIS
National Introduced Marine Pests Information System (managed by CSIRO,
Australia)
NIS
Non-indigenous species
NPA
National Ports Authority (of South Africa)
OBO
Ore/bulk oil tankers (an rather unsuccessful vessel class now used for oil transport
only)
OS
Operating System (of any personal or mainframe computer)
PCU
Programme Coordination Unit (of the GloBallast Programme based at IMO London)
PRIMER
Plymouth Routines In Marine Environmental Research
PBBS
Port Biological Baseline Survey
ROR
Relative overall risk
SAMSA
South African Maritime Safety Authority
SAP
(Regional) Strategic Action Plan
SERC
Smithsonian Environmental Research Center (United States)
VLCC
Very large crude carrier (200,000 300,000 DWT)
ULCC
Ultra large crude carrier (over 300,000 DWT)
ii
Ballast Water Risk Assessment, Port of Saldanha Bay, Republic of South Africa, November 2003: Final Report
Glossary of Terms and Definitions
The following terms and definitions are summarised from various sources including Carlton (1985,
1996, 2002), Cohen & Carlton (1995), Hilliard et al. (1997a), Leppäkoski et al. (2002), Williamson et
al. (2002) and the GloBallast BWRA User Guide. The latter document contains more detailed
definitions with explanatory notes, plus a glossary of maritime terms.
Ballast water
Any water and associated sediment used to manipulate the trim and
stability of a vessel.
Bioinvasion
A broad based term that refers to both human-assisted introductions
and natural range expansions.
Border
The first entrance point into an economy's jurisdiction.
Cost benefit analysis
Analysis of the cost and benefits of a course of action to determine
whether it should be undertaken.
Cryptogenic
A species that is not demonstrably native or introduced.
Disease
Clinical or non-clinical infection with an aetiological agent.
Domestic
Intra-national coastal voyages (between domestic ports).
routes/shipping
Established
A non-indigenous species that has produced at least one self-sustaining
introduction
population in its introduced range.
Foreign routes/shipping
International voyages (between countries).
Fouling organism
Any plant or animal that attaches to natural and man-made substrates
such as piers, navigation buoys or hull of ship, such as seaweed,
barnacles or mussels.
Harmful marine species
A non-indigenous species that threatens human health, economic or
environmental values.
Hazard
A situation that under certain conditions will cause harm. The
likelihood of these conditions and the magnitude of the subsequent
harm is a measure of the risk.
Indigenous/native
A species with a long natural presence that extends into the pre-historic
species
record.
Inoculation
Any partial or complete discharge of ballast tank water that contains
organisms which are not native to the bioregion of the receiving waters
(analogous to the potentially harmful introduction of disease causing
agents into a body as the outcome depends on inoculum strength and
exposure incidence).
Intentional introduction
The purposeful transfer or deliberate release of a non-indigenous
species into a natural or semi-natural habitat located beyond its natural
range.
iii
Ballast Water Risk Assessment, Port of Saldanha Bay, Republic of South Africa, November 2003: Final Report
Introduced species
A species that has been intentionally or unintentionally transferred by
human activity into a region beyond its natural range.
Invasive species
An established introduced species that spreads rapidly through a range
of natural or semi-natural habitats and ecosystems, mostly by its own
means.
Marine pest
A harmful introduced species (i.e. an introduced species that threatens
human health, economic or environmental values).
Non-invasive
An established introduced species that remains localised within its new
environment and shows minimal ability to spread despite several
decades of opportunity.
Pathogen
A virus, bacteria or other agent that causes disease or illness.
Pathway (Route)
The geographic route or corridor from point A to point B (see Vector).
Port Biological Baseline
A biological survey to identify the types of introduced marine species
Survey (PBBS)
in a port.
Risk
The likelihood and magnitude of a harmful event.
Risk assessment
Undertaking the tasks required to determine the level of risk.
Risk analysis
Evaluating a risk to determine if, and what type of, actions are worth
taking to reduce the risk.
Risk management
The organisational framework and activities that are directed towards
identifying and reducing risks.
Risk species
A species deemed likely to become a harmful species if it is introduced
to a region beyond its natural range, as based on inductive evaluation
of available evidence.
Translocation
The transfer of an organism or its propagules into a location outside its
natural range by a human activity.
Unintentional
An unwitting (and typically unknowing) introduction resulting from a
introduction
human activity unrelated to the introduced species involved (e.g. via
water used for ballasting a ship or for transferring an aquaculture
species).
Vector
The physical means or agent by which a species is transferred from one
place to another (e.g. BW, a ship's hull, or inside a shipment of
commercial oysters)
iv
Ballast Water Risk Assessment, Port of Saldanha Bay, Republic of South Africa, November 2003: Final Report
Lead Agencies
Lead Agency for General BW Issues in South Africa:
Contact person:
Dr Lynn Jackson*
Position:
Country Focal Point GloBallast - South Africa, and Program Coordinator,
Global Invasive Species Program.
Organization:
Global Invasive Species Program
Address:
c/o National Botanical Institute, Private Bag X7, Claremont 7735, Republic of
South Africa
Tel:
+27 (0)21 799-8837
Fax:
+27 (0)21 797-1561
Email: jackson@nbi.ac.za
Web:
www.ballastwater-sa.org
* temporary contact on behalf of the Department of Environmental Affairs & Tourism
(DEAT), Marine & Coastal Management.
Contact person:
Dr Larry Hutchings
Position:
Deputy Director - Marine Biodiversity Division
Organization:
Marine & Coastal Management Division, Department of Environmental
Affairs and Tourism.
Address:
Private Bag X2, Roggebaai, 8012, Cape Town, Republic of South Africa
Tel:
+27 (0)21 402-4109
Email: lhutchin@mcm.wcape.org.za
Primary contact for BW Risk Assessments in South Africa:
Contact person:
Ms Leticia Greyling
Position:
Manager, Environmental Research and Best Practice Management
Organization:
National Ports Authority of South Africa
Address:
Room 617 Head Office, 101 De Korte Street, Braamfontein, 2000,
Johannesburg, Republic of South Africa
Tel: +27-(0)11-242-4144
Fax:
+27-(0)11-242-4260
Email:
leticiag@npa.co.za
v
Ballast Water Risk Assessment, Port of Saldanha Bay, Republic of South Africa, November 2003: Final Report
Executive Summary
The introduction of harmful aquatic organisms and pathogens to new environments via ships' ballast
water (BW) and other vectors has been identified as one of the four greatest threats to the world's
oceans. The International Maritime Organization (IMO) is working to address the BW vector through
various initiatives. One initiative has been the provision of technical assistance to developing
countries through the GEF/UNDP/IMO Global Ballast Water Management Programme (GloBallast).
Core activities of the GloBallast Programme are being undertaken at Demonstration Sites in six Pilot
Countries. These sites are the ports at Sepetiba (Brazil), Dalian (China), Mumbai (India), Khark
Island (Iran), Odessa (Ukraine) and Saldanha Bay (South Africa). One of these activities (Activity
3.1) has been to trial a standardised method of BW risk assessment (BWRA) at each of the six
Demonstration Sites. Risk assessment is a fundamental starting point for any country contemplating
implementing a formal system to manage the transfer and introduction of harmful aquatic organisms
and pathogens in ships' BW, whether under existing IMO Ballast Water Guidelines (A.868(20)) or
the new international Convention.
To maximise certainty while seeking cost-effectiveness and a relatively simple, widely applicable
system, a semi-quantitative approach was followed, using widely-supported computer software. The
semi-quantitative method aims to minimise subjectivity by using as much quantitative data as
possible, to identify the riskiest ballast tank discharges with respect to a Demonstration Site's current
pattern of trade. Unlike a fully quantitative approach, it does not attempt to predict the specific risk
posed by each intended tank discharge of individual vessels, nor the level of certainty attached to such
predictions. However, by helping a Demonstration Site to determine its riskiest trading routes,
exploring the semi-quantitative BWRA provides a coherent method for identifying which BW sources
deserve more vessel monitoring and management efforts than others.
This report describes the BWRA activity undertaken for the Port of Saldanha Bay, which is the
Demonstration Site for the Republic of South Africa and managed by its National Ports Authority
(NPA). This capacity-building activity commenced in January 2002, with URS Australia Pty Ltd
(URS) contracted to the Programme Coordination Unit (PCU) to provide BWRA training and
software. Under the terms of reference, the consultants worked closely with their counterparts in a
project team co-managed by URS and the Country Focal Point Assistant (CFPA) for completing all
required tasks. These tasks required two in-country visits by the consultants (in April and August
2002) to install the BWRA software and provide `hands-on' instruction and guidance. Most of the
data collation tasks were undertaken before, between and during these visits, with gap-filling work
undertaken by the consultants prior to a short `project wrap-up' visit in March 2003.
The first step was to collate and computerise data from IMO Ballast Water Reporting Forms
(BWRFs) to identify the source ports from which BW is imported to the Demonstration Site. For
periods or vessel arrivals where BWRFs were not collected or were incomplete, gap-filling data were
extracted from the port shipping records held at the Saldanha port offices. These records also helped
identify which next ports of call may have been a destination port for any BW taken up at Saldanha
Bay.
A multivariate procedure was then used to determine the relative environmental similarity between
the Demonstration Site and each of its BW source and destination ports. Comparing port-to-port
environmental similarities provides a relative measure of the risk of organism survival, establishment
and potential spread. This is the basis of the `environmental matching' method adopted by the project,
which facilitates estimating the risk of BW introductions when the range and types of potentially
harmful species that could be introduced from a particular source port are poorly known.
Another objective of the BWRA was to identify `high-risk' species that may be transferred to and/or
from the Demonstration Site. The customised BWRA database provided by URS therefore contained
tables and interfaces for storing and managing the names, distribution and other information on risk
vi
Ballast Water Risk Assessment, Port of Saldanha Bay, Republic of South Africa, November 2003: Final Report
species. The taxonomic details, bioregional distribution, native/introduced status and level of threat
assigned to a species were stored in the database for display, review and update as well as for the
BWRA analysis. For the purposes of the BWRA and its `first-pass' risk assessment, a risk species was
considered to be any introduced, cryptogenic or native species that might pose a threat to marine
ecological, social and/or commercial resources and values if successfully transferred to or from a
Demonstration Site.
During each visit the consultants worked alongside their Pilot Country counterparts to provide skills-
transfer as part of the capacity building objectives of the programme, with the project team divided
into three groups. Group A mapped the port and its resources using ArcView GIS. This group
included counterparts from the Department of Environmental Affairs and Tourism (DEAT) and NPA,
who helped collate and compile much of the required GIS data. Group B included counterparts from
NPA and was responsible for managing the customised Access database supplied by the consultants,
and for entering, checking and managing the BW discharge data obtained from records held by NPA
personnel at Saldanha Bay and from BWRFs voluntarily submitted by arriving ships. Group B used
the database to identify BW source and destination ports, and it is designed for ongoing input and
management of BWRFs. Group C contained counterparts from NPA and the Centre for Scientific and
Industrial Research's (CSIR) coastal program (Durban), and undertook the environmental matching
and risk species components of the Activity, using the PRIMER package to perform the multivariate
analyses for determining the environmental distances between Saldanha Bay and its source and
destination ports.
The various BW discharge, environmental matching and risk species data described above were then
processed by the database with other risk factors, including voyage duration and tank size, to provide
preliminary indication of:
(a) the relative overall risk posed by each BW source port, and
(b) which destination ports appeared most at risk from any BW uplifted at the Demonstration Site.
This was achieved using a project standard approach, although the database also facilitates instant
modifications of the calculations for exploratory and demonstration purposes. The GloBallast BWRA
also adopted a `whole-of-port' approach to compare the subject port (Demonstration Site) with all of
its BW source and destination ports. The project has therefore established in Cape Town (DEAT) and
Johannesburg (NPA) an integrated database and geographic information system (GIS) that manages
and displays:
· ballast water data obtained from arriving ship BWRFs and port shipping records;
· information on the Demonstration Site's navigational, physical and environmental conditions
and aquatic resources,
· port-to-port environmental matching data,
· risk species data, and
· risk coefficients and graphical categories of risk for ballast discharges.
The results, which were graphically displayed on user-friendly GIS port and world maps as well as in
ranked output tables, help determine the types of management responses.
A total of 1315 vessel visits were entered into the Saldanha Bay database during the activity, the large
majority being extracted and expanded from BW records collated by the port's pollution control
officer between January 1999 and June 2002. This database contained 82 vessel visits to the oil
terminal berth (most laden VLCCs arriving at rates of 1-4 per month from the Gulf and Nigerian oil
export terminals). Reported BW discharges for the oil terminal totalled 1,269,137 tonnes (most
occurring during a period of crude oil re-exports from South Africa's strategic reserve which ceased
in October 1999). The database also contained 593 visits to the iron ore export terminal (most Cape
Class bulk carriers) which reported BW discharges totalling 26,802,325 tonnes, plus a further 607
vii
Ballast Water Risk Assessment, Port of Saldanha Bay, Republic of South Africa, November 2003: Final Report
visits by bulk carriers and general cargo ships to the nearby multi-purpose terminal. BW discharges
reported for the latter totalled 1,576,292 tonnes. On the southwest side of Saldanha Bay, 33 visits
were also made to the Sea Harvest/Cold Store terminal by small reefers (<4,200 DWT), with only one
of these reporting a discharge (200 tonnes of ballasted trim water).
BW source ports identified from the 1307 BW discharge records in the Saldanha database totalled
131. Those `supplying' the highest frequency of BW discharges to Saldanha Bay were Durban (9.2%)
closely followed by Richards Bay (another South African port; 9.1%), then Rotterdam (5.1%) and
Port Talbot (in the United Kingdom; 4.1%). The top thirteen BW source ports provided 50% of all
source-identified discharges, while the next 23 ports contributed a further 25%. Thus 36 of the source
ports (27.3%) accounted for 75% of the total number of source-identified discharges. The total
volume of source-identified discharged BW at Saldanha Bay between January 1999 and June 2002
was 29,647,954 tonnes. The source ports providing the largest volume were Rotterdam (7.3% of the
total volume), Port Talbot (6.5%), Singapore (5.0%) and Immingham (4.2%). Only 30 of all identified
source ports (22.7%) accounted for 75% of the total volume of source-identified BW discharged at
Saldanha Bay.
Many of the most frequent BW source ports were also frequent `Next Ports of Call' (i.e. potential
destination ports for BW uplifted at Saldanha Bay), with Durban, Beilun, Singapore, Rotterdam and
Richards Bay accounting for >33% of those reported by departing vessels. Of the 183 next ports of
call that were recorded, the top 33 were recorded by 75% of the 1315 vessel departures.
Of the identified source and destination ports, sufficient port environmental data were obtained to
include 71% of the former and 51% of the latter in the multivariate similarity analysis by PRIMER.
These ports accounted for 90% of all recorded BW discharges and 84.5% of all recorded departures
respectively. The most environmentally similar port to Saldanha Bay was Piraeus in Greece (its
matching coefficient was 0.78), with 11 other widely distributed ports also having matching
coefficients above 0.7. Another widely dispersed group of ports (37) had relatively high matching
coefficients in the 0.6-0.7 range. The most environmentally dissimilar ports trading with Saldanha
Bay in 1999-2002 were a mixture of cool water and brackish ports, Gulf ports and ports in the humid
tropics. The most frequent recorded next ports of call (Durban and Beilun) had relatively high (0.64)
and moderate (0.58) environmental matching coefficients respectively.
The project standard calculation of the relative overall risk (ROR) identified that 19 of the 131 source
ports (14.5%) provided 20% of the total ROR to Saldanha Bay, and therefore formed the highest risk
group (in terms of their BW source frequency, volume, environmental similarity and risk species
threat). The risk species threat posed by each source port varied according to the number of
introduced and native species in its bioregion and the categorisation of these species as either
unlikely, suspected or known harmful species. The highest risk group were predominantly
Mediterranean, South African and North Asian ports, led by Piraeus in Greece (ROR = 0.250),
Taranto in Italy (0.247) and Gijon in Spain (0.245). The group of source ports accounting for the next
20% of the ROR (i.e. `high risk' ports) was 22, and these were predominantly north Asian, Brazilian
and European ports. The number of BW source ports in the low risk (28) and lowest risk (38)
categories were a mixture of cool, warm and/or brackish water ports and comprised 50% of the total.
The wet tropics port of Onne on the Nigerian coast had the lowest ROR value (0.07). The ROR results
were considered logical given Saldanha's biogeographic location, current pattern of trade and port
type (a natural bay port). They also fitted with the origins of the introduced species already present in
Saldanha Bay (i.e. European and Asian species). The results therefore indicated that the project
standard `first-pass' treatment of the risk coefficients provides a useful benchmark for any
investigative manipulation of the risk calculations and database.
Of the various BWRA objectives and tasks, reliable identification of destination ports that may receive
BW from the Demonstration Site was confounded by the lack of specific questions on the IMO-standard
BWRFs, and the uncertainty of knowing if the Next of Port Call recorded on a BWRF is where Ballast
Water is actually discharged. Thus presently there is no mechanism enabling a `reverse BWRA' to be
viii
Ballast Water Risk Assessment, Port of Saldanha Bay, Republic of South Africa, November 2003: Final Report
undertaken reliably. In the case of Saldanha Bay, this posed an issue for some of the vessels departing the
oil and multipurpose terminals. If more reliable forward-looking BWRAs are to be undertaken to identify
destination ports in the future, supplementary questions will need to be added to the present BWRF,
including the names of the three last ports of call as well as the port where discharges from each
partially or completely ballasted tank are predicted.
The main objectives of the BWRA were successfully completed during the 14 month course of this
project, with the various tasks and exploratory/demonstration software providing a foundation
enabling the regional promulgation of further BW management activities by South Africa. Project
outputs included a trained in-country risk assessment team, and an operational BWRA system and
User Guide for use as a demonstration tool in the region. This places South Africa in a good position
to provide assistance, technical advice, guidance and encouragement to other African port States.
ix
Ballast Water Risk Assessment, Port of Saldanha Bay, Republic of South Africa, November 2003: Final Report
Table of Contents
Acknowledgements......................................................................................................................................i
Acronyms .....................................................................................................................................................ii
Glossary of Terms and Definitions..........................................................................................................iii
Lead Agencies .............................................................................................................................................v
Executive Summary ...................................................................................................................................vi
1
Introduction and Background .........................................................................................................1
2
Aims and Objectives.........................................................................................................................5
3
Methods ..............................................................................................................................................6
3.1
Overview and work schedule .................................................................................................................. 6
3.2
Resource mapping of the demonstration port......................................................................................... 9
3.3 De-ballasting/ballasting patterns ........................................................................................................... 10
3.4 Identification
of source ports.................................................................................................................. 11
3.5 Identification
of destination ports........................................................................................................... 12
3.6 BWRF
database..................................................................................................................................... 13
3.7
Environmental parameters .................................................................................................................... 15
3.8 Environmental
similarity analysis .......................................................................................................... 17
3.9
Risk species ........................................................................................................................................... 18
3.10 Risk assessment.................................................................................................................................... 22
3.11 Training and capacity building............................................................................................................... 27
3.12 Identification
of information gaps........................................................................................................... 28
4
Results..............................................................................................................................................30
4.1 Description
of port.................................................................................................................................. 30
4.2 Resource mapping................................................................................................................................. 35
4.3 De-ballasting/ballasting patterns ........................................................................................................... 36
4.4 Identification
of source ports.................................................................................................................. 40
4.5 Identification
of destination ports........................................................................................................... 44
4.6
Environmental similarity analysis .......................................................................................................... 45
4.7
Risk species ........................................................................................................................................... 51
4.8
Risk assessment results........................................................................................................................ 54
4.9
Training and capacity building............................................................................................................... 57
4.10 Identification
of information gaps........................................................................................................... 58
5
Conclusions and Recommendations...........................................................................................61
5.1
Recommendations................................................................................................................................. 61
5.2
BWRA recommendations and plans by Pilot Country .......................................................................... 62
6
Location and maintenance of the BWRA System ......................................................................63
References..................................................................................................................................................64
APPENDIX 1: Copy of IMO Ballast Water Reporting Form
APPENDIX 2: Risk Assessment Team for the Port of Saldanha, South Africa
APPENDIX 3: Check-list of project requirements
APPENDIX 4: Information sources used for collating Port Environmental Data
APPENDIX 5: Sources and references of Risk Species information
APPENDIX 6: Name, UN code, coordinates and environmental parameters of the 357 ports
used for the multivariate similarity analyses for all Demonstration Sites
APPENDIX 7: Consultants' Terms of Reference
x
Ballast Water Risk Assessment, Port of Saldanha Bay, Republic of South Africa, November 2003: Final Report
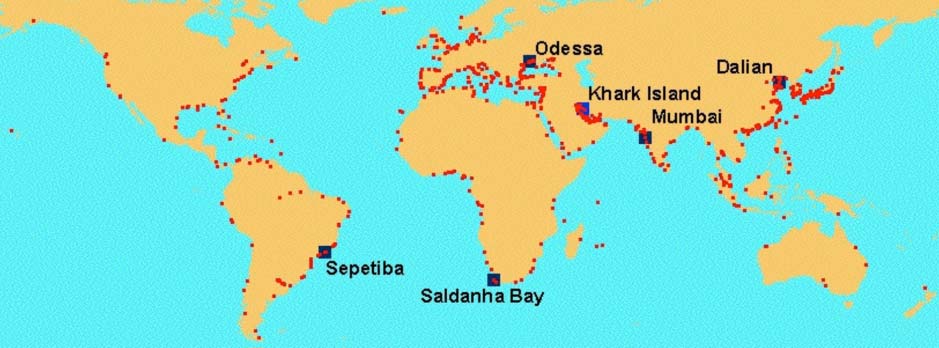
Figure 1.
Locations of the six GloBallast Demonstration Sites and their various ballast water source
and destination ports................................................................................................................................ 3
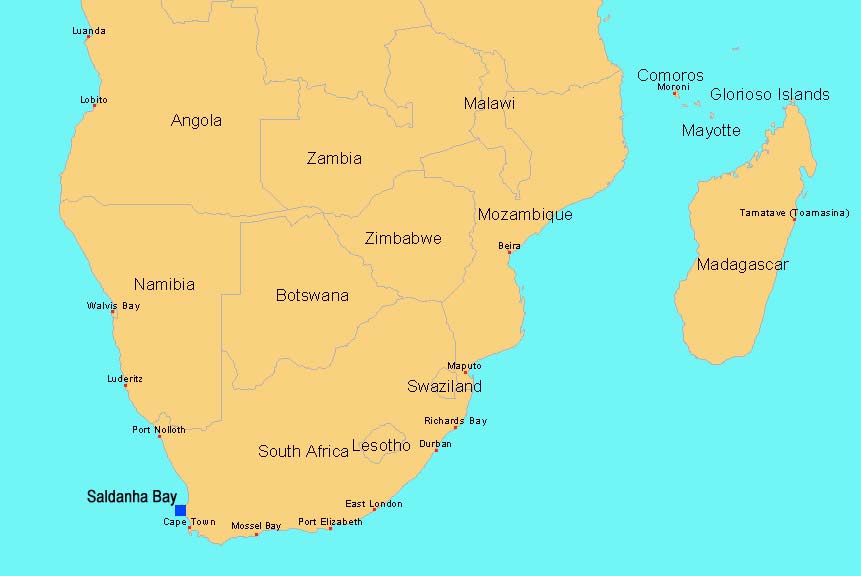
Figure 2.
Location of Saldanha Bay and other ports in the southern African region............................................. 4
Figure 3.
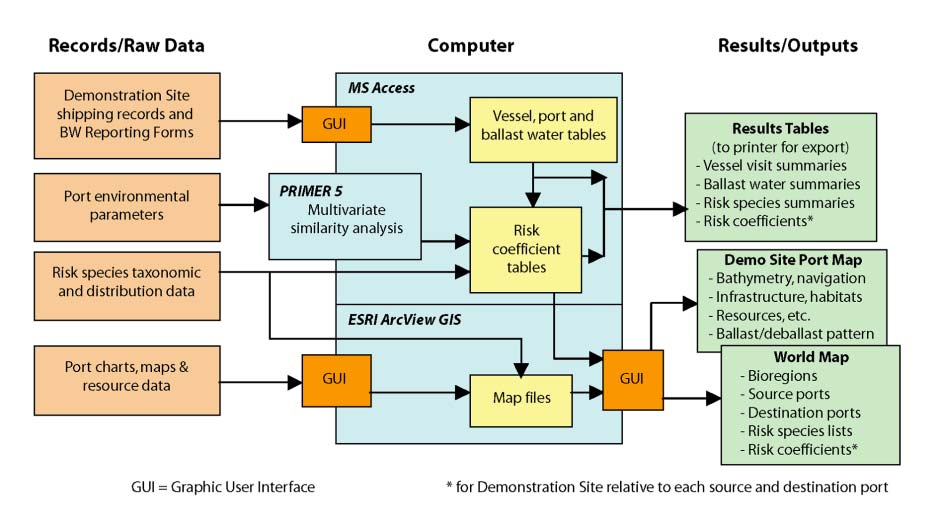
Schematic of the GloBallast BWRA system............................................................................................ 6
Figure 4.
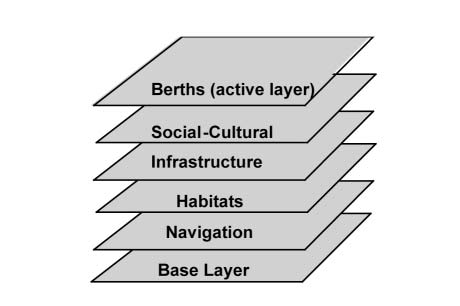
Thematic layers used for the Port Map GIS............................................................................................ 9
Figure 5.
Working page of the Excel spreadsheet used to estimate BW discharges ......................................... 12
Figure 6.
The three tabs of the GUI used for entering the BWRF data ............................................................... 15
Figure 7.
Part of the GIS world map of marine bioregions, showing the code names of those in the
southern African region.......................................................................................................................... 19
Figure 8.
Complete GIS world map showing the marine bioregions
[to improve clarity, not all bioregion codes are shown in this example] ............................................... 20
Figure 9.
Database GUI used for manipulating the BWRA calculation and weightings...................................... 23
Figure 10.
Seasonal and annual wind roses for Saldanha Bay based on 1995-1998 data
(from a CSIR Environmental study commissioned by NPA) ................................................................ 32
Figure 11.
Plots provided by NPA showing median current speeds in the surface depth layer
in Saldanha Bay during summer and winter ......................................................................................... 33
Figure 12.
Part of the GIS Port Map of Saldanha Bay showing the navigation, infrastructure and
active berth layers.................................................................................................................................. 34
Figure 13.
Part of the GIS Port Map showing the marine habitats and reserve layers......................................... 36
Figure 14.
Rate of monthly vessel visits in the Saldanha Bay database............................................................... 38
Figure 15.
BW discharge statistics displayed by GIS Port Map for the ore export terminal. ................................ 39
Figure 16.
BW discharge statistics displayed by GIS Port Map for the multi-purpose terminal............................ 39
Figure 17.
BW discharge statistics displayed by GIS Port Map for the oil terminal ............................................. 40
Figure 18.
GIS output showing location and relative importance of BW source ports
with respect to frequency of tank discharges (C1) at Port of Saldanha Bay. ...................................... 41
Figure 19.
GIS output showing location and relative importance of the source ports
with respect to the volume of tank discharges (C2) at Port of Saldanha Bay...................................... 41
Figure 20.
GIS output showing location and frequency of destination ports, recorded as the
Next Port of Call in the Port of Saldanha Bay BWRFs and shipping records...................................... 44
Figure 21.
GIS output showing the location and environmental matching coefficients (C3)
of BW source ports identified for the Port of Saldanha Bay ................................................................. 46
Figure 22.
GIS output showing the location and environmental matching coefficients (C3)
of the destination ports identified for the Port of Saldanha Bay ........................................................... 46
Figure 23.
GIS output showing the location and risk species threat coefficients (C4)
of the BW source ports identified for the Port of Saldanha Bay ........................................................... 51
Figure 24.
GIS output showing the location and categories of relative overall risk (ROR)
of source ports identified for the Port of Saldanha Bay ........................................................................ 55
Figure 25.
Frequency distribution of the standardised ROR values for all identified source ports....................... 56
xi
1
Introduction and Background
The introduction of harmful aquatic organisms and pathogens to new environments via ships' ballast
water (BW) and other vectors, has been identified as one of the four greatest threats to the world's
oceans. The International Maritime Organization (IMO) is working to address the BW vector through
a number of initiatives, including:
· adoption of the IMO Guidelines for the control and management of ships' ballast water to
minimize the transfer of harmful aquatic organisms and pathogens (A.868(20));
· developing a new international legal instrument (International Convention for the Control
and Management of Ships' Ballast Water and Sediments, as adopted by an IMO Diplomatic
Conference in February 2004); and
· providing technical assistance to developing countries through the GEF/UNDP/IMO Global
Ballast Water Management Programme (GloBallast).
Core activities of the GloBallast Programme are being undertaken at Demonstration Sites in six Pilot
Countries. These sites are the ports at Sepetiba (Brazil), Dalian (China), Mumbai (India), Khark
Island (Iran), Odessa (Ukraine) and Saldanha Bay (South Africa). Activities carried out at the
Demonstration Sites will be replicated at additional sites in each region as the programme progresses
(further information at http://globallast.imo.org).
One of GloBallast's core activities (Activity 3.1) has been to trial a standardised method of BW risk
assessment (BWRA) at each of the six Demonstration Sites. Risk assessment is a fundamental starting
point for any country contemplating implementing a formal system to manage the transfer and
introduction of harmful aquatic organisms and pathogens in ships' BW, whether under the existing
IMO Ballast Water Guidelines (A.868(20)) or the new Convention.
A port State may wish to apply its BW management regime uniformly to all vessels that call at its
ports, or it may wish to assess the relative risk of these vessels to its coastal marine resources and
apply its regime selectively. Uniform application or the `blanket' approach offers the advantages of
simplified administration and no requirement for `judgement calls' to be made. This approach also
requires substantially less information management effort. If applied strictly, the uniform approach
offers greater protection from unanticipated bio-invaders, as it does not depend on the reliability of a
decision support system that may not be complete. However, the key disadvantage of the strict blanket
approach are the BW management costs imposed on vessels which otherwise might not be forced to
take action. It also requires a substantial vessel monitoring and crew education effort to ensure all
foreign and domestic flagged ships are properly complying with the required BW management
actions.
A few nations have started to develop and test systems that allow more selective application of BW
management requirements, based on voyage-specific risk assessments. This `selective' approach
offers to reduce the numbers of vessels subject to BW controls and monitoring, and is amenable to
nations that wish to reduce the introduction, and/or domestic spread, of `targeted' marine species only.
More rigorous measures can be justified on ships deemed to be of high risk if fewer restrictions are
placed on low risk vessels.
For countries/ports that choose the selective approach, it is essential to establish an organized means
of evaluating the potential risk posed by each arriving vessel, through a `Decision Support System'
(DSS). However, this approach places commensurate information technology and management
burdens on the port State, and its effectiveness depends on the quality of the information and database
systems that support it. A selective approach that is based on a group of targeted species may also
leave the country/port vulnerable to unknown risks from non-targeted species.
1
Ballast Water Risk Assessment, Port of Saldanha Bay, Republic of South Africa, November 2003: Final Report
Before a port State decides on whether to adopt the blanket or the selective approach, it needs to carry
out some form of risk assessment for each port under consideration. Ballast water risk assessments
(BWRAs) can be grouped into three categories1:
· Qualitative Risk Identification: this is the simplest approach, and is based on subjective
parameters drawn from previous experience, established principals and relationships and
expert opinion, resulting in simple allocations of `low', `medium' and `high' risk. However it
is often the case that subjective assessments tend to overestimate low probability/high
consequence events and underestimate higher probability/lower consequence events (e.g.
Haugom et al, in Leppäkoski et al. 2002).
· Semi-Quantitative Ranking of Risk: this `middle' approach seeks to increase objectivity and
minimise the need for subjective opinions by using quantitative data and ranking of
proportional results wherever possible. The aim is to improve clarity of process and results,
thereby avoiding the subjective risk-perception issues that can arise in qualitative approaches.
· Quantitative Risk Assessment: this is the most comprehensive approach which aims to
achieve a full probablistic analysis of the risk of BW introductions, including measures of
confidence. It requires significant collation and analysis of physico-chemical, biological and
voyage-specific data, including key lifecycle and tolerance data for every pre-designated
species of risk (`target species'), port environmental conditions, ship/voyage characteristics,
the BW management measures applied, and input and evaluation of all uncertainties. The
approach requires a high level of resourcing, computer networking and sophisticated
techniques that are still being developed1.
The purpose of GloBallast Activity 3.1 has been to conduct initial, first-pass BWRAs for each
Demonstration Site. To maximise certainty while seeking cost-effectiveness and a relatively simple,
widely applicable system, the middle (semi-quantitative) approach was selected.
The first step of the GloBallast method is to collate data from IMO Ballast Water Reporting Forms
(BWRFs) (as contained in Resolution A.868(20); see Appendix 1) to identify the source ports from
which BW is imported to the demonstration port. For periods or vessel arrivals where BWRFs were
not collected or are incomplete, gap-filling data can be extracted from port shipping records.
Source port/discharge port environmental comparisons are then carried out and combined with other
risk factors, including voyage duration and risk species profiles, to give a preliminary indication of
overall risk posed by each source port. The results help determine the types of management responses
required, while the BWRA process provides a foundation block enabling application of more
sophisticated BW management DSSs by Pilot Countries.
The GloBallast approach is not the only one available but is considered to combine the best elements
of the semi-quantitative method to provide useful results within the available budget (US$250,000
spread across the six pilot countries). It has also taken a `whole-of-port' approach which compares the
subject port (Demonstration Site) with all of its BW source and destination ports. The outputs include
published reports, trained in-country risk assessment teams and an operational BWRA system for use
as demonstration tools in each of the six main developing regions of the world, plus a platform and
database to facilitate further DSS development. The GloBallast BWRA activity has therefore
established an integrated database and information system to manage and display:
· ballast water data from arriving ship BWRFs and port shipping records;
· data on the demonstration port's physical and environmental conditions and aquatic
resources,
· port-to-port environmental matching data,
1 for further details see the GloBallast BWRA User Guide.
2
1 Introduction and Background
· risk species data, and
· ballast water discharge risk coefficients.
The results provide a knowledge base that will help the Pilot Countries and other port States to
evaluate the risks currently posed by BW introductions, identify high priority areas for action, and
decide whether to apply a blanket or selective BW management regime. If a selective regime is
adopted, vessel and voyage-specific risk assessments can then be applied using systems such as those
being developed and trialled by the Australian Quarantine & Inspection Service (AQIS Decision
Support System), Det Norsk Veritas in Norway (EMBLA system) and the Cawthron Institute in New
Zealand (SHIPPING EXPLORER), and/or by further development of the GloBallast system. If a
uniform approach is adopted, the results help identify which routes and vessel types warrant the most
vigilance in terms of BW management compliance checking and verification monitoring, including
ship inspections and ballast tank sampling.
The geographical spread and broad representativeness of the six Demonstration Sites also means that
the results help plug a very large gap in the existing global knowledge base. Figure 1 indicates the
broad global spread of the GloBallast risk assessment activity. As a result of this activity,
comprehensive data are now available on source port and destination port linkages, environmental
parameters, environmental matching coefficients, risk species and relative overall risk of BW
transfers for the six GloBallast Demonstration Sites and a total of 723 ports around the world. Project
outcomes will therefore place governments, scientists, the shipping industry and the general public in
a stronger, more enlightened position to deal with the BW problem.
This report describes and presents the results of the first Ballast Water Risk Assessment (BWRA)
carried out for the Port of Saldanha Bay (South Africa) during 2002. This GloBallast Demonstrate
Site is a modern, deepwater bulk and general cargo port which was developed between 1975 and 1990
to provide iron ore export, crude oil import and multi-purpose cargo facilities near Cape Town, which
lies approximately 95 km to the south-east (Figure 2).
Figure 1. Locations of the six GloBallast Demonstration Sites and their various ballast water source and
destination ports.
3
Ballast Water Risk Assessment, Port of Saldanha Bay, Republic of South Africa, November 2003: Final Report
Figure 2. Location of Saldanha Bay and other ports in the southern African region
4
2
Aims and Objectives
The aims of the GloBallast BWRA for the Port of Saldanha Bay were set by the GloBallast
Programme Coordination Unit (PCU), in accordance with Terms of Reference developed by the PCU
Technical Adviser (Appendix 7) and were to:
1. Assess and describe as far as possible from available data, the risk profile of invasive aquatic
species being both introduced to and exported from Saldanha Bay in ships' BW, and to
identify the source ports and destination ports posing the highest risk for such introductions.
2. Help determine the types of management responses that are required, and provide the
foundation blocks for implementing a more sophisticated BW management system for the
Port of Saldanha Bay.
3. Provide training and capacity building to in-country personnel, resulting in a fully trained risk
assessment team and operational risk assessment system, for ongoing use by the Pilot
Country, replication at additional ports and use as a demonstration tool in the region.
The specific objectives of the BWRA for the Port of Saldanha Bay were to:
1. Identify, describe and map on a Geographic Information System (GIS) all coastal and marine
resources (biological, social/cultural and commercial) in and around the port that might be
impacted by introduced marine species.
2. Characterise, describe and map (on GIS) de-ballasting and ballasting patterns in and around
the port including locations, times, frequencies and volumes of BW discharges and uptakes.
3. Identify all ports/locations from which BW is imported (source ports).
4. Identify all ports/locations to which BW is exported (destination ports).
5. Establish a database at the nominated in-country agency for the efficient ongoing collection,
management and analysis of the data collected at the Port of Saldanha Bay via standard IMO
BWRFs.
6. Characterise as far as possible from existing data, the physical, chemical and biological
environments for both Saldanha Bay and each of its source and destination ports.
7. Develop environmental similarity matrices and indices to compare the Port of Saldanha Bay
with each of its source ports and destination ports, as a key basis of the risk assessment.
8. Identify as far as possible from existing data, any high-risk species present at the source ports
that might pose a threat of introduction to the Port of Saldanha Bay, and any high-risk species
present at this port that might be exported to a destination port.
9. Identify any information gaps that limit the ability to undertake the aims and objectives and
recommend management actions to address these gaps.
5
3
Methods
3.1
Overview and work schedule
The BWRA Activity for the Port Saldanha Bay was conducted by URS Australia Pty Ltd (URS)
under contract to the GloBallast PCU, in accordance with the Terms of Reference (Appendix 7). The
consultants worked alongside their Pilot Country counterparts during the country visits to provide
training and skills-transfer as part of the capacity building objectives of the programme. Structure and
membership of the joint project team is shown in Appendix 2.
The consultants adopted an innovative, modular approach that integrated three widely used computer
software packages to provide a user-friendly tool for conducting, exploring and demonstrating semi-
quantitative BWRAs. As shown in Figure 3, the key software comprised:
· Microsoft Access - for the main database;
· PRIMER 5 [Plymouth Routines In Marine Environmental Research] - a versatile multivariate
analysis package from the United Kingdom enabling convenient multivariate analysis of the
port environmental data; and
· ESRI ArcView 3.2 Geographic Information System (GIS) - to graphically display the results
in a convenient, readily interpretable format using port and world maps.
Figure 3. Schematic of the GloBallast BWRA system
The work schedule commenced with project briefing meetings with personnel from all six
Demonstration Sites to arrange logistics and resource needs, during the third meeting of the
GloBallast Programme's Global Task Force, held in Goa, India on 16-18 January 2002 (Appendix 3).
The majority of tasks subsequently undertaken for the Port of Saldanha Bay were completed during
two in-country visits by the consultants (7-12 April and 9-23 August 2002), with information searches
and data collation undertaken by both consultant and pilot country team members between and after
these visits. A `project wrap-up' visit was subsequently made by one of the consultants on 9-11 March
2003.
6
3 Methods
The specific tasks of the week-long first visit were to:
· Install and test the Access, ArcView and PRIMER software and the functionality of the
project computer system, which had been supplied by the GloBallast Programme and
temporarily transferred from the Marine & Coastal Division offices of the Department of
Environmental Affairs and Tourism (DEAT) at Cape Town to a function centre hired at
Saldanha Bay to provide the BWRA team with convenient access to the port and its
personnel.
· Familiarise the project team with the GloBallast BWRA method by seminar and work-
shopping.
· Commence GIS guidance and developing the port map for the Demonstration Site.
· Commence training on the use of the various Graphic User Interfaces (GUI) of the Access
Database for inputting and editing BW discharge data.
· Undertake a guided tour of the port facilities, obtain information on the ballasting practises of
visiting ships and gain an understanding of the coastal habitats and local marine resources.
· Review available port shipping records and BWRFs to identify trading patterns, vessel types,
key BW source ports and likely destination ports.
· Check available port environmental data and identify potential in-country and regional sources
of same.
· Commence listing risk species and identifying potential in-country or regional sources of
same.
· Identify critical information gaps and the data assembly work required before the second visit.
During the longer second visit by the consultants (9-23 August), project work was undertaken at
Johannesburg, Saldanha Bay and Cape Town, with more vessel arrival, voyage data and BW
discharge checking and entries to the database, and addition of the environmental and risk species
data. At the end of the second visit the first BWRA was undertaken and a workshop was held at
DEAT (Cape Town) to present and review the initial results and discuss future country requirements
and actions.
During the third visit in March 2003, the consultants supplied the BWRA project leader and CFP-A
with updated versions of the database and BWRA User Guide on CD-ROM, the former containing
additional port environment and risk species data (as obtained from the BWRA Activities conducted
at the other five Demonstration Sites). The results of the March 2003 version, plus subsequent minor
corrections to some of the vessel visit records and environmental matching assignments (made by
URS in consultation with the project leader and CFP-A) are reported here.
Throughout the schedule, the joint project team was divided into three groups to facilitate training and
progress (Appendix 2). Group A was responsible for developing the port map and graphically
displaying results via the GIS. All coastal and marine resources (biological, social/cultural and
commercial) in and around the port that might be impacted by aquatic bio-invasions were mapped
using the ArcView GIS, using specific layers to show the bathymetry, navigation aids, port
infrastructure and tables of the port's de-ballasting/ballasting patterns (including frequencies and
volumes of discharges and uptakes for the berth locations).
Group B was responsible for managing the customised Access database supplied by the consultants,
and for entering, checking and managing the BW data, as collated from the BWRFs submitted by
arriving ships (and/or derived from shipping records for periods or arrivals when BWRFs were not
obtained or incomplete). This database was used to identify source and destination ports, and was
designed for ongoing input and management of future BWRFs.
7
Ballast Water Risk Assessment, Port of Saldanha Bay, Republic of South Africa, November 2003: Final Report
The requirement for arriving ships to submit to the relevant port State authority a completed
form that complies with the IMO BWRF (Appendix 1) is a fundamental and essential first basic
step for any port State wishing to commence a BW management programme2.
Group C was responsible for collating the port environmental and risk species data, undertaking port-
to-port environmental similarity analyses and performing the BWRA. Thirty four environmental
variables were collated for the Demonstration Site and the majority of its source and destination
ports3, including sea water and air temperatures, salinities, seasonal rainfall, tidal regimes and
proximity to a standardised set of intertidal and subtidal habitats. Where water temperature data or
salinity data could not be found for a source or destination port, values were derived for the riverine,
estuarine or coastal location of the port with respect to the temperature and salinity data ranges of its
IUCN marine bioregion, plus ocean maps depicting sea surface temperature/salinity contours at
quarter degree and degree scales (as obtained from CRIMP [now CSIRO Marine Research], URS and
other sources; Appendix 4).
The multivariate analysis of the port environmental data was undertaken using the PRIMER package,
with the similarity values between the Port of Saldanha Bay and its source and destination ports
converted into environmental matching coefficients then added to the database. Species in or near
source ports that were deemed to pose a threat if introduced to the Demonstration Site, together with
species at the Demonstration Site that might be exported to a destination port, were identified from all
available sources found by the project team. These sources included preliminary results from the Port
Biological Baseline Surveys (PBBS; as recently completed at each Demonstration Site by another
GloBallast Activity), recent reviews of marine species introduced to South African waters and
searches of `on-line' databases such as those under ongoing development by the Smithsonian
Environmental Research Center (SERC), the Australian Centre for Research on Introduced Marine
Pests (CRIMP; now CSIRO Marine Research), the Baltic Regional Marine Invasions Database and
the Global Invasive Species Programme (GISP) (Appendix 5). The species taxonomic information
and bioregional distributions were also added to the Access database. The combined BW discharge,
environmental matching and risk species coefficients provided the basis of the semi-quantitative risk
assessment.
Graphic User Interfaces (GUIs) customised by the consultants for the Access database and ArcView
GIS were used to generate results tables and graphical outputs that were displayed on interactive maps
of the Demonstration Site and World bioregions. The various BWRA outputs can be printed, exported
to other software, or viewed interactively to enhance the user-friendliness and management utility of
the system.
The methods used to attain each objective of the BWRA Activity are summarised in the following
sections, with technical details of the risk assessment procedures provided in the GloBallast BWRA
User Guide. This manual was developed by the consultants to facilitate BWRA training and
demonstrations for all six GloBallast Pilot Countries. The BWRA User Guide comprises a separate
document that accompanies this report, and is available from the GloBallast PCU
(http://globallast.imo.org).
2 Several port States (e.g. Australia) and Demonstration Sites (e.g. Dalian, Odessa, Sepetiba) have produced
their own BWRFs, the latter using translated formats to permit improved BWRF understanding and
completion by local shipping. Such BWRFs need to include all questions of the IMO standard form. Problems
arising from voluntary submission of BWRFs are described in Section 4.10.
3 The complete set of source and destination ports identified for the six Demonstration Sites (723) remained
unknown until the end of the BWRF/port record data collation, database entry and checking phases (i.e. end of
the second round of in-country visits; 22 December 2002). A gap-filling effort was made by the consultants to
obtain the environmental parameters during January 2003, but this had to focus on the most frequently
recorded of these ports, since there was insufficient time or resources to order charts and search for the
environmental data for all of them (the majority of which were associated with few or only single vessel
arrivals). For these ports, their environmental matching values were provided by a comparison method
described in Section 4.6.
8
3 Methods
3.2
Resource mapping of the demonstration port
The port resources were mapped using ArcView GIS to display the bathymetric, navigational and
infrastructure features, including habitats and social-cultural features. The scope of the Saldanha Bay
port map extends from the coastal waters beyond its mouth to the top of the 15 km long Langebaan
Lagoon which enters the south side of Saldanha Bay. The map also extends north-westward to
encompass all edges of the bay, the town of Saldanha and nearby rocky headlands.
Vector-based electronic nautical charts were not available for Saldanha Bay or the Langebaan
Lagoon, so Group B counterparts generated the coastline/bathymetry and navigation layers by
capturing salient details from 600 dpi scanned colour images of nautical hydrographic charts covering
the Saldanha Bay and Langabaan Lagoon area (i.e. charts SAN-C2, SAN-C2052, and SAN-1011).
Chart SAN-C2 covered 90% of the required area and its scan was used by Group A for the initial
digital registering, capture and ArcView training during the consultants first visit.
Shipping channels, anchorage areas and other navigational features were added using point and
pattern symbols based on the international IHO/IALA system (details below). Infrastructure and
social cultural information was also captured from these charts, with other items and reserve
boundaries added from maps, tourist guides and mariculture site data obtained during the port tours
which made during both the first and second consultants visits. Group C assisted Group A to assemble
the marine habitat layer during the second visit, using PBBS field survey results supplied by the CFP-
A and information from DEAT marine biologists at Cape Town. Gap-filling required for some of the
subtidal habitat boundaries was achieved via interpretation of the seafloor substrate symbols and
bathymetric contours of the three nautical charts. For clarity and convenience of GIS data
management and display, each `theme' of information was added as a separate layer that followed the
scheme shown in Figure 4. An animated GIF.AVI file showing the pulsed upwelling movements into
Saldanha Bay was provided by the CFP-A and linked to the port map.
Figure 4. Thematic layers used for the Port Map GIS
The protocol for the five main layers are described in the BWRA User Guide and summarised below:
Base Layer: The base layer includes important planimetric features such as depth contours, jetties,
important channels and other permanent or at least semi-permanent `reference' features that are
unlikely to change or move. The key features of the base layer for the Port of Saldanha Bay
comprised:
· Coastlines of the mainland and various islands within and beyond Saldanha Bay and the
Langebaan Lagoon (as depicted by the high tide mark on the nautical charts).
· The low tide mark (i.e. the 0 metre bathymetric contour of hydrographic charts).
· 5 metre isobath (often the first continuous contour below the low tide mark).
9
Ballast Water Risk Assessment, Port of Saldanha Bay, Republic of South Africa, November 2003: Final Report
· 10 metre, 20 metre and 30 metre isobaths.
· Edges of the main shipping channels (often blue or purple lines showing the boundary of
depths maintained by port dredging programs).
The colour scheme of the base layer followed that of standard nautical charts to maintain the familiar
land/sea depth effect.
Navigational Layer: The standard navigational symbols of the IHO/IALA system were followed as
closely as possible. ArcView's symbol libraries do not contain these international navigation symbols,
and convenient third-party symbology could not be found despite extensive searches of public domain
web resources. Closest-match point and pattern symbols were therefore developed for this purpose,
using the UK Hydrographic Office Chart No. 5011 (= IHO INT 1) as the source.
Habitat Layer: This layer used a standardised, logical colour scheme to facilitate recognition of the
main intertidal and subtidal habitat types in and near the port. These included the intertidal mud flats,
sand beaches, rocky shorelines and artificial walls, plus subtidal sand, mud and rocky seafloor areas,
as obtained from DEAT and the PBBS subtidal seafloor information. Some of the natural and
artificial habitat boundaries were based on the notes and chart annotations made by BWRA team
members during their inspection tours of the port facilities and Langebaan Lagoon, as undertaken by
vehicle on 10 April and 15 August 2002.
Infrastructure Layer: This shows the urban and developed land areas around the bay, plus the major
and minor roads, railway lines, power lines and airstrips. The urbanised residential areas at Diazville,
Langebaan and Saldanha are also shown, as is the main fishing jetty and vessel repair and
maintenance wharf beside the town.
Social-Cultural Layer: Social-cultural features include the boundaries of the three designated
mariculture areas in Saldanha Bay, prohibited fishing areas and those of the West Coast National Park
that encapsulates the Langebaan Lagoon.
Berth Layer: An `active' berth layer was added to show the principal berthing and anchorage areas at
the Port of Saldanha Bay. Their names and numbers were supplied by the NPA officer at Saldanha
Bay (Mr Jim Norman). This nomenclature was also used for the berthing area information stored in
the Access database, to allow display of statistical summaries of the BW source and discharge data on
the correct locations of the GIS port map (the GloBallast BWRA User Guide shows how the database-
GIS link is established).
3.3 De-ballasting/ballasting
patterns
The deballasting/ballasting patterns at Saldanha Bay were discussed with the local NPA officer and
then during the port tour's visit to the control tower on 15 April 2002, where the team met the acting
harbour master and discussed recent and current port trade, pilotage rules and draft requirements, use
of the two anchorages and the main deballasting/ballasting practises and locations. Excel files of port
shipping records that summarised BW discharges reported by vessels visiting from 1991 to early
2002, as collated and maintained by the NPA pollution control officer Mr Jimmy Norman4, were
supplied to the CFP-A.
These were examined during the consultants first visit, and it was agreed that records from 1999
onward were more complete and would be suitable for entry if gap-filling was undertaken to increase
the vessel, port and voyage details. It was relatively simple to determine where and which arriving
ships discharged or uplifted BW by identifying their berthing location and vessel type, because the
port has oil import and ore export terminals. Further BW discharge information was entered into the
4 This record listed the vessel name, its arrival and departure dates, berthing area, last and next ports of call, and the total
volume and reported source of BW discharged.
10
3 Methods
database prior to the consultant's second visit, as entered on IMO-style BWRFs that NPA port
officers commenced distributing and collecting on a voluntary but very much encouraged basis in
April 2002. However not all of the general cargo ships and small bulk carriers arriving at its
multipurpose terminal were either fully loading or unloading cargo, and it was often unclear if and
how much BW was being taken up.
3.4 Identification of source ports
To provide confidence as to which ports were the predominant sources of BW discharged at Saldanha
Bay, the 1999-2002 records for vessel visits and BW discharges maintained by the NPA officer at
Saldanha Bay were added to the Access database, plus the 101 IMO-style BWRFs collected by NPA
officers between 1 April - 30 June 2002.. Due to the encouragement and information supplied by NPA
port officers regarding the purpose of the BWRFs, the number of ships voluntarily submitting these
forms was 34 per month (i.e. above the overall 1999-2002 average of 31.3 visit records/month and
virtually 100% of arrival). Nevertheless the majority of source ports were identified from the much
larger former set of records. Data from the BWRFs were entered into the database by a student at
NPA's Johannesburg office prior to the consultants second visit in August 2002. While this generated
two types of data-entry errors in the database, these were tracked down and fixed by the original
Group B counterparts during the consultants second visit (Section 3.6).
For visit records showing a curious Last Port of Call or only a country as the source of discharged
BW (i.e. no source port or location coordinates provided), cross-checks were made of records for the
same and/or similar types of vessel using the same terminal. The Lloyds Fairplay Port Guide and
Lloyds Ship Register5 were also used by Group B counterparts to confirm source port trade and the
IMO identification number, vessel type and DWT of arriving ships respectively. Before any new port
was added to the database by Group B, its name and country name spelling, location coordinates,
bioregion and unique UN Port Code number were checked using the Lloyds Fairplay World Ports
Guide and the world bioregion list in the database (port data input is detailed in the GloBallast BWRA
User Guide).
Some of the gaps in the NPA ship visit record and BWRFs could therefore be filled by checking the
vessel name, ID, type and DWT, its previous visit history, last port/s of call and apparent charter/liner
trade. Missing or peculiar BW discharge values were checked using a customised Excel spreadsheet
supplied by the consultants to estimate the amount BW probably discharged or taken up6 (Figure 5).
This was less easy for the vessels arriving at the multi-purpose berths where cargos may be part
loaded and/or unloaded during a visit, but the majority of the 1999-2002 records and most BWRFs
were completed to the level allowing a database visit entry and a record of likely BW discharge
volume and source.
In fact most of the BWRFs collected in April-June 2002 did not require extensive gap-filling or
reliability checking, as most were checked individually by the NPA Pollution Control Officer. In the
case of unusual BW values, these were checked using the same Excel spreadsheet to determine likely
volumes based on vessel type, DWT, last port/source port and loading record. The main checking and
gap-filling exercise of the 1999-2002 NPA vessel visit records and the BWRF entries was therefore
undertaken by Group B members during the second in-country visit, with the database of 1315 vessel
visits compiled from:
· the vessel visit and total BW discharge details from NPA-supplied Excel files for January
1999- March 2002, with the Fairplay Port Guide, Lloyds Ship Register and port shipping
records used to identify, add or correct port details, vessel names, IMO numbers, types
5 A CD-ROM version of the 2001 Lloyds Ship Register was supplied to each Demonstration Site by PCU. These are much
faster to use than the large `directory style' hard-copy volumes.
6 The BW spreadsheet contains coefficients of ballast water taken up or discharged when loading or discharging
cargo (as percentages of DWT for each vessel type), based on ballast water capacity and discharge data from
other studies, BWRFs and Lloyds Ship Register.
11
Ballast Water Risk Assessment, Port of Saldanha Bay, Republic of South Africa, November 2003: Final Report
DWTs, and voyage duration (to provide minimum storage times since the BW source dates
had not been recorded);
· using the BWRFs and above manuals to correct the many database errors arising from student
entry of these forms (Section 3.6); and
· cross-checking unusual BWRFs with previous records, the Lloyds Ship Register, Fairplay
Port Guide and Excel spreadsheet to correct obvious errors and/or add missing data.
Figure 5. Working page of the Excel spreadsheet used to estimate BW discharges
3.5 Identification of destination ports
Since `prevention is better than cure', it is usually most effective to address environmental problems
as close to their source as possible. In the case of ballast-mediated aquatic bio-invasions, actions
helping prevent ships taking up harmful organisms from ballasting areas may be more effective than
trying to treat the organisms once they are inside the tanks, or trying to manage the problem at the
discharge port. To date, however, the majority of actions addressing ballast-mediated introductions
have been driven and undertaken by ports and port States that receive BW, with little activity
occurring at the locations of BW uptake. The GloBallast programme has therefore been attempting to
shift some of the focus from shipboard/point-of-discharge measures towards reducing the uptake of
organisms in the first place.
Knowing the destinations where departing vessels will discharge BW is an important step in helping
port States to reduce the spread of unwanted and potentially harmful species (either introduced or
native to their own ports) to their trading partners. It is also critical for preventing unwanted species
translocations between a State's domestic ports and/or its neighbouring foreign ports. Determining the
destinations of BW exported from the Demonstration Site was therefore an objective of the GloBallast
BWRA (Section 2).
Both the BWRFs and port shipping records for Saldanha Bay list the Next Port of Call of all departing
vessels, and these were added to the database for analysis. However the next port of call may not be
where BW carried by a departing ship is discharged, either fully or partly. For example, the next port
may be a bunkering, crew-change or maintenance port, a port where a `top-up' or other minor cargo is
loaded, or a convenient `hub' port where ships anchor and wait for new sailing instructions.
To overcome this problem, a supplementary question needs to be added to the present IMO BWRF,
i.e. requesting the name of the port where discharge from each ballast tank is predicted. These ports
can be predicted by ships engaged on a regular liner service (e.g. most container ships, vehicle
carriers, Ro-Ro ships, LNG carriers and some bulk carriers). However for other ship types (and
occasionally the former) ship officers cannot reliably anticipate where BW discharges will be
12
3 Methods
necessary. For example, for bulk carriers, general cargo ships and tankers engaged in spot charter
work (or when completing a charter period), these vessels may often depart in ballast having a
received a general sailing order to proceed towards a strategic location until further instructions.
In the case of the Port of Saldanha Bay, there is a regular import of crude oil requiring the visiting
tankers to uplift ballast water whilst unloading to maintain trim, stability and sufficient draft for their
safe departure into the South Atlantic. The next ports of call of these and the other vessel visits were
therefore added to the vessel visit data and examined, so that the Pilot Country team could gain
experience and appreciate the problem of identifying ballast water destinations.
Adding the next port of call also improves the trading history for each vessel, and these can be useful
when trouble-shooting missing or incorrect BWRF data. As with the source ports, any new next port
of call added to the database was provided with its country name, UN Port Code, world bioregion and
location coordinates to enable its frequency of use by departing vessels to be displayed on the GIS
world map (port input details are in the GloBallast BWRA User Guide).
3.6 BWRF
database
The Access database developed by the consultants manages all items on the IMO standard BWRF.
Entry, editing and management of the BWRF records are undertaken using a series of GUIs, as
described in Section 2 of the BWRA User Guide. The three `tab' pages of the GUI used for general
BWRF data and the individual ballast tank inputs are shown in Figure 6.
Items not listed on the BWRF but required by the database to run the risk analysis and display the
results on the GIS include the geographic coordinates, bioregion and UN code (a unique five letter
identifier) of every source and destination port, plus the DWT and berthing location of every arrival at
the Demonstration Site. For other Demonstration Sites many berthing locations had to be identified
from the port shipping records because the BWRA objectives include identifying the locations within
a Demonstration Site where deballasting/ballasting occurs (Section 2). In the case of Saldanha Bay,
however, this was not a major problem owing to the dedicated nature of two of the terminals and
supplementary information obtained from NPA's senior port officer. During the consultants first visit
it was recommended that port officers collecting the IMO-BWRFs should remember to annotate the
berthing location on the submitted forms, thereby avoiding unnecessary workload during data-entry.
One item requiring frequent look-up was the vessel's deadweight tonnage (DWT) since the BWRF
requests only the gross tonnage (GT). As noted in Section 3.4, adding the DWT (present in the Lloyds
Ship Register) enables convenient checks of reported volumes and gap-filling of missing values
(below).
Not all of the BWRF question fields need to be completed to provide a visit record that can be saved
to the database and used for the risk analysis. A basic visit record can be established if three key items
are entered. These are outlined in red on the input GUIs (Figure 6) and are:
· Vessel identification - a unique 7 digit IMO number that remains the same for the life of the
ship, irrespective of any name changes;
· Arrival date; and
· A ballast tank code (which appears on the `Add Tank' sheet and provides an `All Tanks'
option for port records or BWRFs that do not contain individual tank details).
Without these three items the database cannot save a visit or tank record or any other associated
information. Whether or not a visit record is included by the database for the risk analysis depends on
which other BWRF fields were completed or gap-filled. Key items are the source port and volume for
each (or all) ballast tanks discharged, the berthing location and the BW source and discharge dates. As
described in Sections 3.4 and 3.5, important BWRF information that is missing or incorrect can
usually be substituted or corrected by cross-checking with port shipping records, the Lloyds Ship
13
Ballast Water Risk Assessment, Port of Saldanha Bay, Republic of South Africa, November 2003: Final Report
Register and a comprehensive port directory such as the Fairplay guide. However this is time-
consuming, and it is far more efficient and reliable for port officers to ensure the BWRF has been
filled in correctly and completely at the time of submission. In the case of missing BW source dates
from the 1999-2002 records, these had to be estimated from the durations of standard 14 knot voyages
(typically available in port guides and maritime atlases) then added to the BW discharge records in the
database.
The database contains reference tables which hold the checked details of every vessel and port
previously added. A new visit record is therefore made by entering the arrival date then using a series
of drop-down lists to select the vessel, source port, last port, next port, destination port and tank
details (Figure 6). This avoids the need to re-enter the same information over and over again, as well
as the risk of generating false, `replicate' vessel, port or tank names due to spelling mistakes on the
BWRF.
This was the main problem arising from the student entries of the BWRFs prior to the second visit
(Section 3.4), with over 80 replicate ports and numerous replicate vessels (many with incorrect
spellings and/or identifier codes) needing to be tracked, checked with original BWRFs, and deleted or
corrected to allow the database to operate properly.
Spelling mistakes on BWRFs and port shipping records are common. All data-entry and database
managers therefore need to understand how to avoid transcribing such errors by carefully checking all
names and ID numbers using the database drop-down lists and, where necessary, by referring to a
reliable ship registry or port directory when entering the details of a new vessel or port respectively.
As confirmed by NPA's experience (as well as Brazil's for the Sepetiba Demonstration Site), hire of
students as casual labour to accelerate BWRF data entries is not cost-effective.
The most easily-trained and efficient database operators are those with previous port and maritime
experience since they (a) bring knowledge of the local shipping trade, (b) are familiar with the
problems of searching for vessel names (e.g. Tokyo Maru 2, Tokyo Maru II , Tokyo Maru No. 11 etc),
and (c) are aware that the official name of many ports in Europe, Africa and South America may be
quite different from the English name (e.g. Vlissingen versus Flushing).
14
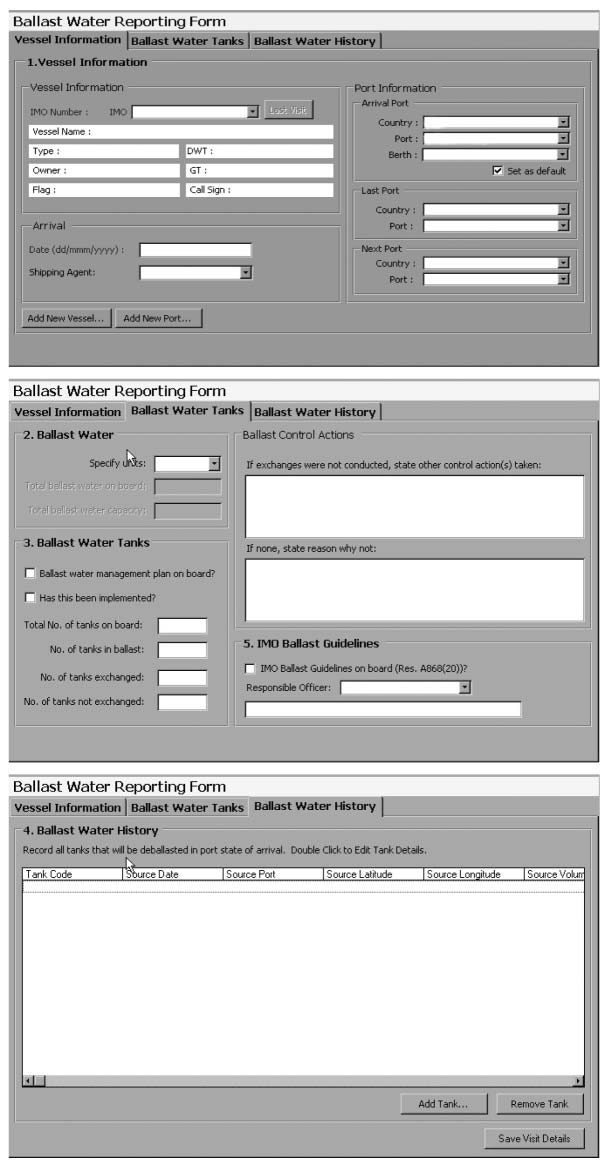
3 Methods
Figure 6. The three tabs of the GUI used for entering the BWRF data
3.7
Environmental parameters
During the briefing meetings in January 2002, the consultants provided a preliminary list of
environmental parameters that would be used to generate the environmental matching coefficients
between the Demonstration Sites and their main BW source ports and destination ports (Appendix 3).
15
Ballast Water Risk Assessment, Port of Saldanha Bay, Republic of South Africa, November 2003: Final Report
The provisional list was based on review of previous port-to-port environmental analyses undertaken
for twelve trading ports in northeast Australia (Hilliard et al. 1997b). The final list of 34 parameters
used for the six Pilot Countries (Table 1) was selected in February 2002, during a joint review of the
provisional list by the consultants and scientists of the Institute of Biology of the Southern Seas
(IBSS) in Odessa7.
Table 1. Port environmental parameters used by the Environmental Similarity Analysis
Name
Variable Type
1.
Port type8
Categorical (1-6)
2.
Mean water temperature during warmest season (oC)
Scalable
3.
Maximum water temperature at warmest time of year (oC)
"
4.
Mean water temperature during coolest season (oC)
"
5.
Minimum water temperature at coolest time of year (oC)
"
6.
Mean day-time air temperature recorded in warmest season (oC)
"
7.
Maximum day-time air temperature recorded in warmest season (oC)
"
8.
Mean night-time air temperature recorded in coolest season(oC)
"
9.
Minimum night-time air temperature recorded in coolest season (oC)
"
10.
Mean water salinity during wettest period of the year (ppt)
"
11.
Lowest water salinity at wettest time of the year (ppt)
"
12.
Mean water salinity during driest period of year (ppt).
"
13.
Maximum water salinity at driest time of year (ppt).
"
14.
Mean spring tidal range (metres)
"
15.
Mean neap tidal Range (metres)
"
16.
Total rainfall during driest 6 months (millimetres)
"
17.
Total rainfall during wettest 6 months (millimetres)
"
18.
Fewest months accounting for 75% of total annual rainfall
Integer
19.
Distance to nearest river mouth (kilometres; negative value if upstream)
Scalable
20.
Catchment size of nearest river with significant flow (square kilometres)
"
Logarithmic distance categories (0-5): From the closest BW discharge location to nearest:
21.
Smooth artificial wall
Categorical
22.
Rocky artificial wall
"
23.
Wooden pilings
"
24.
High tide salt marsh/lagoon, saline flats or sabkah
"
25.
Sand beach
"
26.
Shingle, stony or cobble beach
"
27.
Low tide mud flat
"
28.
Mangrove fringe/mangrove forest
"
29.
Natural rocky shore or cliff
"
30.
Subtidal firm sandy sediments
"
31.
Subtidal soft muddy sediments
"
32.
Seagrass meadow9
"
33.
Rocky reef or pavement
"
34.
Coral reef (with carbonate framework)
"
The 34 parameters were steadily collated during course of BWRA activities for all Demonstration
Sites. They were taken or derived from data and information culled from a wide range of government,
port and scientific publications, internet web sites, port survey reports and sampling records, SST and
salinity charts, climate databases, atlases, national tide-tables, nautical charts, coastal sensitivity and
oil spill habitat maps, oil spill contingency plans, aerial photographs, national habitat databases and
local expert advice (Appendix 4). The most difficult to find were reliable water temperature and
7 Distance categories from the berthing area/s to the nearest rocky artificial wall, smooth artificial wall and
wooden artificial substrate were suggested by IBSS as they provide different types of hard port habitat.
8 Offshore terminal or mooring / Natural bay / Breakwater harbour / Tidal creek / Estuary / River port.
9 Kelp forest/macroalgae bank was not included but should be considered for future analysis.
16
3 Methods
salinity data, particularly for identifying the averages, maxima and minima for ports in or near
estuaries (Section 3.12).
A preliminary list of frequently recorded BW source ports and destination ports for the Port of
Saldanha Bay was made at the end of the first in-country visit in April 2002 (the complete list did not
become available until near the end of the second in-country visit; Section 3.1). It was agreed that the
environmental parameters for these ports should be sought between the first and second consultants'
visits, with Group C members focussing on important ports in South Africa, and the consultants
focussing on more distant ports in Europe, South America, Asia and Australia. To facilitate this task
the consultants provided a customised Excel spreadsheet for collating the environmental data, which
included guidance and reminder notes plus a format enabling direct export to PRIMER (Section 3.8).
Near the end of the second in-country visit, sufficient port environmental data had been collated to
generate environmental matching coefficients for approximately 40% of all ports identified as trading
with the Port of Saldanha Bay, with estimates provided for ports where unobtained/incomplete data
prevented their inclusion in the multivariate similarity analysis (Section 4.6). The percentage of ports
with calculated environmental coefficients was subsequently expanded by a gap-filling exercise
undertaken by the consultants between 22 December 2002 and 31 January 2003. These were added to
the updated BWRA provided at the third meeting in March 2003 (Section 3.1) and reported here.
3.8 Environmental similarity analysis
The more a BW receival port is environmentally similar to a BW source port, the greater the chance
that organisms discharged with the imported BW can tolerate their new environment and maintain
sufficient numbers to grow, reproduce and develop a viable population. Comparing port-to-port
environmental similarities therefore provides a relative measure of the risk of organism survival,
establishment and potential spread. This is the basis of the `environmental matching' method, and it
facilitates estimating the risk of BW introductions when the range and types of potentially harmful
species that could be introduced from a particular source port or its bioregion are poorly known.
A limitation of the environmental matching approach is that several harmful species appear capable of
tolerating relatively wide temperature and salinity regimes10. As discussed, other risk factors include
the frequency of ship visits/BW discharges, the volume of BW discharged, voyage times and ballast
tank size and any management measures applied during the voyage. While environmental matching
alone does not provide a complete measure of risk, an analysis of `real world' invasions indicates that
if any one factor is to be used alone, environmental matching is probably the best single indicator of
risk.
Classic examples include the two-way transfer and relatively rapid spread of harmful and other
unwanted species between the Ponto-Caspian and North American watersheds (some via stepping
stones in western Europe, and northern Australian ports that have extremely high risk factors in terms
of frequency and volumes of BW discharges (the very large bulk export ports of Port Headland,
Dampier and Hay Point and smaller bulk export ports like Weipa and Abbot Point), but which have
not experienced any significant harmful invasions (due to a low environmental matching with their
source ports). Conversely, in southern Australia and in particular Tasmania, ports which have
relatively low risk factors in terms of frequency and volumes of BW discharges, have been the entry
points of the most harmful aquatic bio-invasions (due to a high environmental matching with their
source ports).
The environmental distances between the Port of Saldanha Bay and its source and destination ports
were determined using a multivariate method in the PRIMER package. Of the various distance
measures available in PRIMER, the normalised Euclidean distance is the most appropriate.
Normalisation of the various input parameters removes the problem of scale differences, and the
10 For example, the Asian date mussel (Musculista senhousia) has been reported from Vladivostok to Singapore.
17
Ballast Water Risk Assessment, Port of Saldanha Bay, Republic of South Africa, November 2003: Final Report
method can manage a mix of scalable, integer and even categorical values, provided the latter reflect a
logical sequence of intensity or distance/location steps. Individual variables cannot be weighted but
the predominance of temperature variables (8) and salinity/salinity-related parameters (also 8; see
Table 1) ensured they exert a strong influence on the results. Air temperature extrema, rainfall and
tidal parameters were included owing to their influence on the survivorship of intertidal and shallow
subtidal organisms11. The similarity values produced by PRIMER were examined using its clustering
and ordination modules, then exported back to the Excel file for conversion into environmental
matching coefficients before insertion into the database12.
To provide consistent and comparable results, the similarity analysis was conducted on a wide
geographical range of ports; i.e. from cold water ports in high latitude areas to warm water ports in
tropical regions, as well as from up-river terminals to those located in relatively exposed offshore
waters. This avoids the possibility of generating spurious patterns among a set of ports located in
neighbouring and/or relatively similar regions. Collating the environmental parameters for the
frequent source and destination ports of all six Demonstration Sites into a single Excel spreadsheet
achieved this, as well as permitting direct comparisons between the results from these sites13.
The Excel file used for collating the port environmental data also contains linked spreadsheets used
for their export to PRIMER, as well as for re-importing the results and converting them into
environmental matching coefficients. In fact the database can import any type of environment
matching value obtained by any method, provided the values are placed in an Excel spreadsheet in the
format expected by the database's import feature. Details on the treatment of the environmental
variables and the production, checking, conversion and import of the similarity measures are given in
the BWRA User Guide.
3.9 Risk
species
One of the BWRA objectives was to identify `high-risk' species that may be transferred to and/or
from the Demonstration Sites (Section 2). The Access database was therefore provided with tables for
storing the names, distribution and other information on risk species. For the purposes of the BWRA
and its `first-pass' risk assessment, a risk species was considered to be any introduced, cryptogenic or
native species that might pose a threat if transferred from a source port to a Demonstration Site. The
taxonomic details, bioregion distribution, native/introduced status and level of threat assigned to a
species are also stored in the database and can be displayed for review, edit and update.
The database manages the bioregional locations and status of each entered species using the same
bioregions displayed on the GIS world map (Figures 7, 8). This map is used as a backdrop for
displaying the source and destination ports and associated BWRA results, and was compiled from a
bioregion map provided by the Australian Centre for Research on Introduced marine Pests (CRIMP).
The boundaries of some bioregions were subsequently modified according to advice provided by
Group C marine scientists in five of the six the Pilot Countries. The modifications included adding
new bioregions for several large river systems to accommodate some important river ports that trade
with one or more of the Demonstration Sites. No change was required for the Saldanha Bay bioregion
(WA-IV; Figure 7).
11 While ecosystem disturbance, pollution, eutrophication and other impacts on habitats and water quality can
increase the `invasibility' of port environments (particularly for r-selected species), these were not included
owing to the problem of obtaining reliable measures of their spatial extent and temporal nature at each port.
12 As described in the BWRA User Guide, a simple proportional conversion of the similarity values was made
so that each matching coefficient lay between 1 (a perfect environmental match) and 0.01 (least matching),
since it is unsafe to assume a port environment can be totally hostile no matter how distant.
13 The total number of ports with a complete set of environmental parameters obtained by the end of the data
collation phase was 357. These were provided to all Demonstration Sites during the third consultant's visit in
February-March 2003 and used for this report.
18
3 Methods
The map presently displays 204 discrete bioregions which are coded in similar fashion as those in the
IUCN scheme of marine bioregions from which they were derived (Kelleher et al. 1995; see
Appendix 3 of the GloBallast BWRA User Guide for details). Bioregions serve multiple purposes and
are required for several reasons. Many marine regions of the world remain poorly surveyed and have a
limited marine taxonomy literature. This causes a patchy and essentially artificial distribution of
recorded marine species distributions. Few marine species surveys have been undertaken in port
environments and there are very few bioregions which contain more than one port that has undertaken
a PBBS.
Bioregions represent environmentally similar geographic areas. Thus if a species is found established
in one part of a bioregion, there is a good chance it can spread via natural or human-mediated
processes to other sites in the same bioregion. A conservative approach was therefore adopted for the
GloBallast BWRA, whereby a risk species, if recorded in at least one location of a bioregion, is
assumed potentially present at all source ports within the same bioregion. This type of approach will
remain necessary until a lot more PBBSs are conducted and published. Because taxonomic analyses
of the PBBS samples of the Demonstration Sites had not been completed by the consultants second
visits, the reverse stance was adopted for these ports (i.e. it was assumed they did not contain any risk
species recorded at other location/s in their bioregion).
The corresponding set of bioregions stored in the database has particular sets of risk species assigned
to them. The species and associated data added to the database over the course of the Activity were
collated from a wide range of sources. These included preliminary lists of organisms found by the
recent GloBallast PBBS of Saldanha Bay (which became available during the second consultants
visit), plus two literature reviews of introduced species in southern Africa (Awad & Jackson 2001,
Gollasch & Griffiths 2001). South African and URS members of Group C also investigated the
possible existence of introduced species lists held by marine biologists in agencies and universities in
the African region but none were located.
Figure 7. Part of the GIS world map of marine bioregions, showing the code names of those in the southern
African region
19
Ballast Water Risk Assessment, Port of Saldanha Bay, Republic of South Africa, November 2003: Final Report
Figure 8. Complete GIS world map showing the marine bioregions
[to improve clarity, not all bioregion codes are shown in this example]
20
3 Methods
Sources used for developing the risk species database also included a range of literature plus
international and regional internet databases, including those being developed by the Smithsonian
Environmental Research Center's (SERC) National Estuarine & Marine Invasive Species Information
System (NEMISIS), CSIRO's National Introduced Marine Pests Information System (NIMPIS), the
Global Invasive Species Programme's (GISP) Global Invasive Species Database, and the Baltic,
Nordic and Gulf of Mexico web sites (see list in Appendix 5). The database used for the `first-pass'
risk assessments and provided to the Demonstration Sites during the consultants last visit (March
2003) contains 421 species but these do not represent a complete or definitive global list. Thus the
database tables and their associated Excel reference file represent a working source and convenient
utility of risk species information that can be readily updated and improved.
To provide a measure of the risk species threat posed by each source port, the database analyses the
status of each species assigned to each bioregion and generates a set of coefficients that are added to
the project-standard calculation of relative overall risk (Section 3.10). The following description is
summarised from Section 6 of the GloBallast BWRA User Guide, which describes how the species
data are managed and used by the BWRA system.
The database allows each species to be assigned to one of three levels of threat, with each level
weighted in log rhythmic fashion as follows:
· Lowest threat level: This is assigned to species with no special status other than their
reported or strongly suspected introduction by BW and/or hull fouling14 in at least one
bioregion (i.e. population/s with demonstrated genetic ability to survive transfer and establish
in regions beyond their native range). A fixed weighting (1) is applied to each of these species
when present in bioregions outside their native range. This was also the default level assigned
to any new species when first added to the database.
· Intermediate threat level: This level is assigned to any species suspected to be a harmful
species or invasive pest. Risk species assigned to this level receive a default weighting value
of 3 in both their native and introduced bioregions.
· Highest threat level: This level is assigned to known harmful invasive species, as reported in
institutional or government lists of aquatic nuisance species and pests, and/or in peer-
reviewed scientific journals. The default weighting value applied to these species is 10.
The database allows users to change the threat status level assigned to each species, as well as the size
of the second and third level default weighting values. A third type of risk species weighting option is
also available. This can be used to proportionally increase the weight of all source port threat
coefficients by increasing its default value of 1. The four default values (1, 3, 10 and 1) provided a
`project standard' result to permit unbiased comparisons between the `first-pass' BWRA results for
each Demonstration Site.
The database calculated the coefficient of `risk species threat' posed by each source port, with each
port value representing a proportion of the total risk species threat. The latter was the sum of all
weighted risk species assigned to the bioregion of all source ports that export BW to the
Demonstration Site. Species assigned to more than one bioregion are summed only once, and the
algorhythm automatically discounted any species that was native in the Demonstration Site's
bioregion. It included any introduced species assigned to the bioregion of the Demonstration Site
14 At the outset of the project, species capable of transfer only by ballast water were planned to be added to
the database. However many species may be introduced by hull fouling as well as BW, with the principal
vector for many of these remaining unclear. Group C scientists in all Pilot Countries were unanimous in
their preference for including all species introduced by ballast water and/or hull fouling in the project
standard BWRA database. For future BWRAs a `vector status' value could be assigned to each species in
the database, so that risk assessments could be focussed on either or both of these shipping-mediated
vectors.
21
Ballast Water Risk Assessment, Port of Saldanha Bay, Republic of South Africa, November 2003: Final Report
since, as discussed above, the Demonstration Site was assumed to be free of risk species. This was
the default position of the project-standard BWRA15.
The risk species coefficient for each source port is therefore calculated by firstly summing the number
of non-indigenous species (NIS) in that port's bioregion which have no suspected or known harmful
status. This provides a measure of the low level `weedy' and sometimes cosmopolitan species which,
although having no acknowledged harmful status, have proven transfer credentials that could enable
their establishment in another port with probably low but nevertheless unpredictable biological or
economic consequences. This number is then added to the sums of suspected and known harmful
species in the same bioregion (these include any native species identified as such by Group C local
scientists). The default calculation for the risk species coefficient for each source port (C) is thus:
CSource Port = (NIS + [Suspected Harmfuls x 3] + [Known Harmfuls x 10] ) / Total SumAll Source Ports
The C values lie between 0-1 and represent an objective measure of the relative total species threat,
since the only subjective components within the project standard BWRA database were the
`universal' assignments of species to particular levels of threat, plus the weightings attached to these
levels. Note that the C values for source ports inside the same bioregion will be the same, and that the
Total Sum divisor does not represent all species in the database, but only those assigned to bioregions
containing source port/s that actually trade with the Demonstration Site. It should also be noted there
are several limitations from incorporating a risk species coefficient into the default calculation of the
`first-pass' BWRAs. These included:
· Use of an incomplete list of species that were assigned to one of the three levels of threat
(introductions, suspected harmful species, known invaders).
· Significant knowledge gaps on the global distribution of many native, cryptogenic and
introduced species (as a consequence of the limited number of species surveys that remain
geographically biased to parts of North America, Europe and Australian/New Zealand).
· Gaps and constraints in the taxonomy and reliable identifications for many aquatic species
groups.
Such limitations must be taken into account when considering the weighting of the risk species
coefficient relative to the other risk factors such as environmental matching.
3.10 Risk assessment
Approach
The database employed the BW discharge, port environmental matching and bioregion species
distribution/threat data to calculate, as objectively as possible, the relative risk of a harmful species
introduction to a Demonstration Site, as posed by discharges of BW and associated organisms that
had been ballasted at each of its identified source ports. A GUI enabling convenient alteration of the
risk calculations and weighting values (Figure 9), plus use of ArcView to geographically the display
results, improves the system's value as an exploratory utility and demonstration tool.
The semi-quantitative method aims to identify the riskiest tank discharges with respect to a
Demonstration Site's present pattern of trade. Unlike a fully quantitative approach, it does not attempt
to predict the specific risk posed by each intended tank discharge of individual vessels, nor the level
of confidence attached to such predictions. However, by helping a Demonstration Site to determine its
riskiest trading routes, exploring the semi-quantitative BWRA provides a coherent method for
15 When the taxonomic identifications of the recent port biological baseline surveys are completed, risk
species confirmed as already present at a Demonstration Site may be identified for the BWRA database
maintained for that site. Their deletion would reduce the size of the risk species coefficients obtained by the
`first-pass' BWRA such as reported here for Saldanha Bay, but the revised database should not be copied
for other port BWRAs.
22
3 Methods
identifying which BW sources deserve more vessel monitoring and management efforts than others,
plus the significance of local, regional and distant trading routes and associated vessel types.
Figure 9. Database GUI used for manipulating the BWRA calculation and weightings
Risk coefficients and risk reduction factors
For each source port, the database used four coefficients of risk (C1-C4) and two risk reduction
factors (R1, R2) to produce a relative overall measure of the risk of a harmful species introduction at
the Demonstration Site. The database GUI shown in Figure 9 can be used to remove one or more of
these components, or alter the way they are treated, from the default `project-standard' formula which
was used for the first-pass BWRA. The four risk coefficients calculated for each source port were:
C1 proportion of the total number of ballast tank discharges made at the Demonstration Site,
C2 proportion of the total volume of BW discharged at the Demonstration Site,
C3 port-to-port environmental similarity, as expressed by the matching coefficient,
C4 source port's contribution to the total risk species threat to the Demonstration Site, as posed
by the contemporary pattern of trade (1999-2002).
In biological terms, C1 and C2 represent the frequency and size of organism `inoculations'
respectively. C3 provides a measure of the likely survivability of these inoculated organisms, and C4
the relative threat posed by the organisms within each inoculation. Each coefficient has values
between 0-1 except C3, where the lowest value was set to 0.01 (it is unsafe to assume a port
environment can be sufficiently hostile to prevent survival/establishment of every transferred
introduced species; Section 3.8).
23
Ballast Water Risk Assessment, Port of Saldanha Bay, Republic of South Africa, November 2003: Final Report
The two risk reduction factors calculated by the database were R1 (effect of ballast tank size on C2)
and R2 (effect of tank storage time on C4). R1 represents the effect of tank size on the number and
viability of organisms that survive the voyage, since water quality typically deteriorates more rapidly
in small tanks than large tanks (owing to the volume/tank wall ratio and other effects such as more
rapid temperature change, with mortality rates generally higher in small tanks). As described below,
no risk reduction was applied to any source port dispatching vessels with tank volumes greater than
1000 tonnes.
R2 represents the effect of tank storage time on the range and viability of discharged organisms.
Survival of most phytoplankton and aerobic biota inside any tank decreases with time, with relatively
high survival rates reported for voyages less than 5 days (as shown below, this was adopted as the cut-
off point for any risk reduction due to in-tank mortality). If the focus is only on long-lived anaerobes,
dinoflagellate cysts or pathogens (all of which have long tank survival rates), then R2 can be deleted
from the BWRA calculation, using the GUI shown in Figure 9 (details are in the GloBallast BWRA
User Guide).
The database calculates the tank storage time by subtracting the reported tank discharge date from the
ballast uptake date. For incomplete BWRFs with missing discharge or uptake dates, the vessel arrival
date plus a standard voyage duration at 14 knots16 were used to estimate the BW uptake date for
adding to the database. The database automatically provides values for R1 and R2 using a log
rhythmic approach17, with the project-standard BWRAs applying the following default (but
adjustable) R1 and R2 risk-reduction weightings to C2 and C4 respectively:
R1
Maximum tank volume discharged (tonnes) in
<100
100-500
500-1000
>1000
the database record for each source port
W4
Default risk-reduction weighting applied to C2
0.4
0.6
0.8
1
R2
Minimum tank storage time (days) in the
<5
5-10
10-20
20-50
>50
database record for each source port
W5
Default risk-reduction weighting applied to C4
1
0.8
0.6
0.4
0.2
Although all information reported in the ballast tank exchange section of the BWRFs was entered into
the database, the `first-pass' BWRA did not use these data to apply a risk reduction factor for each
source port route for the following reasons:
· implementation of the BWRFs at the Demonstration Sites has been relatively recent, and the
tank exchange did not provide a sufficiently consistent or reliable sample of ballast
importation for most sites (Section 3.4);
· BWRF implementation was generally on a voluntary basis, with no formal mechanism
compelling all vessels to submit fully completed forms at Mumbai-JNP;
· insufficient vessel inspection/ tank monitoring data were available for checking claimed
exchanges and their locations (often unrecorded);
· discounting whether or not effective exchange/s were taking place (a) removed the need to
predict the size of the risk reduction, and (b) was precautionary with respect to the ability of
exchanges to remove all organisms taken up at the time of ballasting.
16 The voyage duration between ports for particular vessel speeds are tabled in many maritime guides and
atlases, such as the Lloyds Maritime Atlas of World Ports and Shipping Places and the 2001 Fairplay Port
Directory.
17 As with the risk species threat level weightings, a log rhythmic approach is appropriate for risk reduction
factors in biological risk assessments.
24
3 Methods
BWRA calculation
As shown in Figure 9 and described in the GloBallast BWRA User Guide, the database GUI allows the
six components of the BWRA calculation and the five weighting factors to be altered from the default,
`project-standard' setting. The GUI can therefore be used to explore how particular risk components
and their treatment influence the final result, and also improves the demonstration value of the system.
One example is the way the environmental matching coefficient (C3) is treated by the BWRA
calculation. For scientists who consider that C3 should be treated as an independent coefficient of risk
(see below), then the formula for calculating the relative overall risk (ROR) posed by a source port is:
(1)
ROR = ( C1 + [C2 x R1W4] + C3 + [C4 x R2W5] ) / 4
Equation (1) is the default setting used for the project-standard BWRA for each Demonstration Site.
In this case, ROR is the combined measure of the proportional `inoculation' frequency (C1) and size
(C2), the relative similarity of the source port/Demonstration Site environmental conditions (C3), and
the relative level threat posed by the status of species assigned to the source port's bioregion (C4).
The division by 4 keeps the result in the 0-1 range to allow the convenient expression of the ROR as a
ratio or percentage of the total risk posed by all the source ports.
For those who consider the proportional risk species threat (C4) should provide the focal point of the
risk calculation, they may prefer to treat C3 as a risk reduction factor for influencing the size of C4,
rather than using it as an independent `surrogate' coefficient to help cover unidentified or unknown
species. The GUI allows the formula to be changed to reflect this approach, in which case C3 would
be applied as follows:
(2)
ROR = ( C1 + [C2 x R1W4] + [C3 x C4 x R2W5] ) / 3
[divisor is now 3 because of the reduced number of summed coefficients].
For a source port in a bioregion with a large number of risk species (eg. a relatively high C4 of 0.2)
but with an environment very dissimilar to the Demonstration Site (e.g. C3 = 0.2), then Equation (2)
would reduce C4 to 0.04 (i.e. an 80% reduction). If the minimum tank storage time was relatively
long (e.g. R2 was between 10-20 days for the quickest voyages, so W5 = 0.6), then C4 would be
further reduced to 0.024 (i.e. an 88% reduction to its initial value).
Table 2. Examples showing how Equation (1) provides more conservative outcomes than (2) for typical
situations*
Relative Proportion of Proportion of Environ-
Relative
Overall
discharge
discharge
mental
Risk species
(*when C1 and C2 are less than 50%)
Risk
Frequency
Volume
matching
threat
ROR
C1
C2
C3
C4
ROR
= [C1 + C2 + C3 + C4] / 4 Equation (1)
0.150
0.1
0.1
0.2
0.2
ROR
= [C1 + C2 + (C3 x C4) ] / 3 Equation (2)
0.080
0.1
0.1
0.2
0.2
ROR
= [C1 + C2 + C3 + C4] / 4 Equation (1)
0.200
0.2
0.2
0.2
0.2
ROR
= [C1 + C2 + (C3 x C4) ] / 3 Equation (2)
0.147
0.2
0.2
0.2
0.2
ROR
= [C1 + C2 + C3 + C4] / 4 Equation (1)
0.350
0.5
0.5
0.2
0.2
ROR
= [C1 + C2 + (C3 x C4) ] / 3 Equation (2)
0.347
0.5
0.5
0.2
0.2
ROR
= [C1 + C2 + C3 + C4] / 4 Equation (1)
0.400
0.6
0.6
0.2
0.2
ROR
= [C1 + C2 + (C3 x C4) ] / 3 Equation (2)
0.413
0.6
0.6
0.2
0.2
ROR
= [C1 + C2 + C3 + C4] / 4 Equation (1)
0.450
0.7
0.7
0.2
0.2
ROR
= [C1 + C2 + (C3 x C4) ] / 3 Equation (2)
0.480
0.7
0.7
0.2
0.2
ROR
= [C1 + C2 + C3 + C4] / 4 Equation (1)
0.550
0.9
0.9
0.2
0.2
ROR
= [C1 + C2 + (C3 x C4) ] / 3 Equation (2)
0.613
0.9
0.9
0.2
0.2
Equation (2) is logical provided the database contains an accurate distribution of appropriately
weighted risk species in the various source port bioregions (including native species considered
potentially harmful if they established in other areas). However Equation (2) is less conservative than
Equation (1), particularly if there are doubts that C4 provides a true picture of potential risk species
25
Ballast Water Risk Assessment, Port of Saldanha Bay, Republic of South Africa, November 2003: Final Report
threat. As shown in Table 2, Equation (1) produces higher ROR values, unless a single source port
accounts for over 50% of the frequency (C1) and volume (C2) of the total discharges at a
Demonstration Site (this is highly unlikely). The database also allows users to increase the influence
of C4 on the ROR by increasing the default value of the overall W3 weighting factor from 1 (but see
the caution in Section 3.10). Increasing the size of C4 has more affect in Equation (1) because C3 has
no direct influence on the size of C4.
Managing and displaying the results
When the database is requested to calculate the BWRA, it generates a large output table that lists all
sources of tank discharges recorded at the Demonstration Site, as entered from the BWRFs and/or
derived from the port's shipping records. The table shows the ROR values plus their component
coefficients and reduction factors. Because the Demonstration Sites have a large number of source
ports (80-160), trends are difficult to see within long columns of tabled values.
The ROR results are therefore further manipulated by the database to provide additional columns
showing:
· the risk category of each source port, as placed in one of five levels of risk for displaying on
the GIS world map;
· a standardised distribution of the ROR results, i.e. from 1 (highest ROR value) to 0 (lowest
value).
The five risk categories are labelled `highest', `high', `moderate', `low' or `lowest', with their
boundaries set at equal linear intervals along the 0-100% scale of cumulative percentage risk (i.e. at
80%, 60%, 40% and 20% intervals). This is the default setting used for the project-standard BWRAs.
The database GUI (Figure 9) allows users to shift one or more of these boundaries to any point on the
scale. For example, a logbased distribution of the five risk categories may be preferred and is easy to
produce using the GUI.
In the case of the standardisation, the database applies the following simple manipulation to expand
the distribution of ROR values to occupy the 0-1 range, where 1 represents the maximum ROR value
and 0 the minimum value:
RORSTANDARDISED = (ROR RORMINIMUM) x 1/ (RORMAXIMUM RORMINIMUM)
This facilitates comparisons between BWRA results from other sites, as well as from different
treatments of the ROR formula and/or the weightings. As with the ArcView GIS, the database was
designed to optimise the user-friendliness, flexibility and management utility of the system.
Rationale for undertaking `Project Standard' BWRAs
The flexibility provided by the database allows users to investigate and demonstrate various
permutations and avenues without requiring specialised knowledge in database construction and
editing. However it was important to apply a consistent, straightforward approach to the `first-pass'
BWRA for each Demonstration Site, so their outcomes could be compared and contrasted to help (a)
evaluate the system and approach, and (b) identify areas where changes could improve future use.
Each Demonstration Site has a particular trade profile and associated pattern of
deballasting/ballasting. Their divergent geographic locations further contributes to their possession of
unique sets of BW source ports which have relatively limited overlap. Thus if results from any two or
more Demonstration Sites are to be compared, all of their shared and non-shared source ports and
bioregions need to be combined for calculating the environmental matching and risk species threat
coefficients.
It was therefore decided that, because the six sites effectively span the globe, the `project-standard'
BWRAs undertaken for each site should use the same global set of source port environment and risk
26
3 Methods
species data. This ensures the port-to-port similarities and risk species threats were based on the
widest possible range of port conditions and species distributions, thereby reducing the potential for
spurious results resulting from overly narrow regional approaches (Section 3.8).
3.11 Training and capacity building
Members of the consultants team worked with their South African counterparts to provide BWRA
guidance, training, software and associated materials on the following occasions:
Occasion/ Date
Location and
BWA Activity Tasks
Consultants
[working days]
Counterparts*
Activity Kick-Off Presentation, briefing and logistics meetings.
NIO Offices in Goa.
January 2002
Identify equipment and counterpart requirements.
R Hilliard
CFP:/CFPAs from
[1.5 days]
Develop provisional pilot country visit schedule.
all Pilot Countries
1st Country Visit
Introductory half-day seminar.
DEAT office, Cape
8-12 April 2002
Install and check computer software.
Town and Blue Bay
[5 work days]
function room at
Commence training and capacity building.
Saldanha Bay.
Begin GIS mapping of port and resources.
Port familiarisation tour.
D Blumberg Group A counterparts
Review BWRFs and Port Shipping Records.
J Polglaze
Group B counterparts
Commence BWRF database development &
R Hilliard
Group C counterparts
training.
Review port environmental data and identify
sources.
Seminar & tutorials on multivariate similarity
analysis
Identify data collation/input tasks before 2nd visit.
2nd Country Visit
Update Database GUIs, add-ins & make ODBC
DEAT office, Cape
8-23 August 2002 links.
Town and Blue Bay
[10 days]
Continue training and capacity building.
function room at
Saldanha Bay.
Complete GIS mapping of port and resources.
Complete BWRF database development and
C Clarke
training.
Group A counterparts
J Polglaze
Complete port environmental data
Group B counterparts
R Hilliard
assembly/training.
Group C counterparts
Complete environmental similarity analysis
training.
Generate environmental matching coefficients.
Add risk species data to database, refine
bioregions.
Complete BWRA training and undertake first
analysis
Hold seminar to review and discuss results.
Discuss pilot country needs for future BWRA.
3rd `Wrap-up'
Provide Database containing all port environmental
Visit
and risk species data obtained for the six sites.
DEAT office, Cape
6-9 March 2003
Town
Provide updated BWRA User Guide and final
[2.5 days]
training on BWRA system operation.
BWRA project leader
C Clarke
and CFP-A
Review and discuss updated BWRA results.
* refer Appendix 2 for project team structure and counterpart details.
27
Ballast Water Risk Assessment, Port of Saldanha Bay, Republic of South Africa, November 2003: Final Report
At the kick-off meeting in January 2001, CFP/CFPAs were briefed on the nature, objectives and
requirements of the activity. An introductory PowerPoint presentation describing the BWRA system
proposed for achieving the BWRF objectives was made, and logistics meetings with individual Pilot
Countries subsequently held. A project check-list and briefing document were distributed listing the
computer hardware and peripherals required at each Demonstration Site plus the proposed structure of
the joint Pilot Country-consultants project team (see Appendices 2 and 3). Appropriate experience of
Pilot Country counterparts for the three groups forming the team was emphasised during the kick-off
meetings.
During the subsequent in-country visits by the consultants, the main BWRA training and capacity-
building components provided were as follows:
· Supply of software licences and User Guide and installation of ESRI ArcView 3.2 and
PRIMER 5.
· Guidance and `hands-on' training and in GIS mapping of marine resources.
· Supply of 2001 CD-ROM edition of the Lloyds Ship Register, and customised Excel
spreadsheet file for convenient collation of vessel identification and DWT data and reliable
estimation of BW discharges from port shipping records, for gap-filling pre-BWRF records
and BWRF checking.
· Guidance, hands-on training and assistance with the Access database and BWRF
management;
· Guidance, hands-on training and glossaries of terminology on the collation, checking, gap-
filling and computerisation of BWRFs and principles of database management.
· Guidance and assistance on (a) search, collation and computer entry of environmental data for
important BW source and destination ports, and (b) the terminology, networking, data
collation and management requirements for species information used for the risk species
threat coefficient.
· Tutorial, hands-on training and assistance on theory, requirements and mechanics of
multivariate similarity analyses of port and coastal environmental data.
· Tutorial, guidance, hands-on training, seminars and PowerPoint material on BWRA
approaches, methods and results evaluation.
· Supply of electronic BWRA User Guide with glossaries and technical appendices.
To promote collaboration, understanding and continuity among the three Groups, the consultants
arranged for group counterparts to provide presentations and guidance to other group members during
the 1st and 2nd visits.
3.12 Identification of information gaps
This was a critical part of the activities undertaken during the first in-country visit by the consultants,
with attention focussed on locating and checking the following BWRA information input
components:
·
Completeness of BWRFs submitted by vessels arriving at the Demonstration Site.
·
Gaps, legibility and authenticity of information reported in the returned BWRFs.
·
Sources and availability of port shipping records for BWRF gap-filling.
·
Existence of electronic and paper charts, topographic and coastal resource maps, atlases,
aerial photographs, water current studies and other relevant publications useful for the GIS
port map.
·
Sources, reliability and extent of port environmental data and coastal resource information for
Demonstration Site and its trading ports in the Pilot Country and region.
·
Sources and extent of marine species records, information and researchers on introduced
species in and near the Pilot Country.
28
3 Methods
At the end of the first country visit, the status of the above were reviewed and a list of gap-filling
tasks, as allocated to the Pilot Country groups or consultants and to be undertaken by the second visit,
were agreed upon and minuted. Follow-up gap-filling tasks were also conducted during and after the
second visit.
29
4 Results
4.1 Description of port
General features
Saldanha Bay is a deep and well-protected natural harbour in the Western Cape Province of South
Africa, and has been used by ships to provide safe shelter since its discovery and mistaken naming by
Juris van Spilbergen in 1601. This Dutch captain thought he was close to Cape Town (then called
Agoada de Saldanha) but the bay is actually located some 95 km to the north-west at 33o 02' S 17o58'
E (Figures 2, 12). Although Saldanha Bay has been frequently used by ships for shelter and safety
since the 17th century, plus a garrison, whaling station (1909-1930 and 1948-1967) and important
convoy assembly point (1940s), its lack of freshwater and distance from Cape Town precluded any
commercial port development until the 1970s.
The south-east part of Saldanha Bay connects with the 14 km long and 2-3 km wide Langebaan
Lagoon, which is a very popular fishing and boating area as well as an important wildlife conservation
area. Since the early 1980s increasing coastal industrial development, residential, recreational, tourism
and mariculture activities at Saldanha Bay have exerted considerable anthropogenic pressure on its
water quality, aquatic habitats and communities (Morant & Quinn 1999). In response to these
pressures, an integrated coastal management plan was developed during the 1990s by the Department
of Environmental Affairs and Tourism (DEAT). The Langebaan Lagoon was declared a National
Park in 1988, is a protected wetland under the Ramsar Convention for the conservation of waders and
other water birds, and was recently recommended by the South African Government to UNESCO for
World Heritage listing.
Climate and weather
The temperate coastal waters of the Western Cape Province are heavily influenced by the cold water
Benguela current and its coastal upwelling system, which also influence its weather and rainfall
pattern. Thus the province's subtropical climate experiences long and relatively warm summers
dominated by SE winds, followed by cool and moist winters dominated by south-westerly gales and
cold fronts. Mean day-time temperatures regularly exceed 26oC during high summer (maxima to
~35oC), while night-time temperatures often fall below 10oC in mid-winter (minima to 4oC). Annual
rainfall is low (343 mm) with most rainfall during May-September. Seasonal and annual wind roses
showing the direction and strength of the prevailing winds are shown in Figure 10. Seas are typically
calmest during the summer months, although the prevailing south to south-westerly winds can reach
gale force (Figure 10). While the strongest winds are from this direction and occur in all four seasons,
the passage of winter storms fronts is marked by strong north to north-westerly winds (Figure 10).
Berthing and sailing movements can be hampered by driving rain and/or high swells in winter, and by
morning fogs between spring and summer.
Hydrodynamic conditions
Saldanha Bay and its connecting Langebaan Lagoon form an unusual embayment system along the
>1,000 km of mostly exposed rocky coastline of the Western Province, which faces a high energy
wave regime and has few sheltered areas. Tidal currents in the open areas of Saldanha Bay are not
particularly strong owing to the relatively small tidal range, which is close to 1.5 m for average
springs (extreme range is 2.2 m) and 0.6 m during neaps. The strongest tidal flows occur during ebb
spring tides at narrow locations such as the entrance near Marcus Island, and in the channel
connecting the bay to the Langebaan Lagoon. The "Wasserfall Bank", located between Jutten and
Malgas Islands at the entrance to the outer bay, is the most significant tidal feature of the bay.
30
4 Results
There are no significant river inputs into Saldanha Bay or nearby lagoon, with their waters originating
from the Benguela shelf upwellings that occur at roughly 8 day cycles from spring to autumn. In fact
Saldanha Bay is driven by these upwellings, with its water quality characteristics altering according to
seasonal and smaller-scale changes to the upwelling pulses. These pulses maintain open coastal water
characteristics inside the bay, with water temperature rangings between 9-23°C and salinities rarely
departing from a narrow oceanic range of 34-36°/oo throughout most of the system (CSIR 2000). As a
result of the annual dynamics of the Benguela upwellings, which typically develop in August and
persist until near the end of May, the water temperature, salinity, oxygen and stratification regime of
Saldanha Bay can be divided into the following three seasonal phases (Monteiro et al. 1998):
· Phase 1: Early spring and early summer (August-December)
· Phase 2: High summer and early autumn (January-April)
· Phase 3: Late autumn and winter (May-July)
From August-December, the springtime rise in solar warming warms the surface water temperature in
the bay reflect while the increasing strength of the SE winds intensify the force and duration of the
upwelling inflows into the bay, in turn decreasing the near-bottom temperatures. These cold, nutrient
rich inflows stimulate both natural and farmed shellfish growth and reproduction within the bay.
The regular and mostly 8-day upwelling cycles which are established by early summer can
subsequently be disrupted by unusually calm mid-summer periods where no upwelling forces occurs.
For example, the almost persistent calms experienced in 9-28 December 1999 stopped the nutrient-
rich inflows, in turn causing a warming of the bottom layer, a major change to phytoplankton regime,
and a precipitous decline in the post-spawning mussel recovery and growth that threatened the
economic viability of Sea Harvest Fishing Co., the major mariculture producer in the bay (CSIR
2000). Such periods are more typical of the late summer period and increase the chances of causing
harmful algal blooms, and these have tended to appear firstly in the coastal waters beyond the mouth
of the bay (Monteiro & Largier, 1999).
From late April to July, the fall in solar heating reduces surface water temperatures as well as the
strength and persistence of the SE winds, with the concomitant weakening of the upwelling cycles
causing a gradual increase to the bottom layer temperatures. Thus the late summer (March-April)
surface water temperatures of 18-20oC and near-bottom water inflow temperature of ~10oC steadily
converge to the 13-14oC range. This lasts for the short June-July winter, the main period when there is
no naturally induced vertical stratification and the presence of a well-mixed water column until
August.
Each upwelling cycle that occurs from August to May causes dissolved oxygen concentrations to
oscillate between upper values that characterise the near-surface layer (~3 ml/L) and minima which
characterise the near-bottom inflow of cold, dense upwelled shelfal water. While the newly upwelled
water has oxygen concentrations in the 3-4 ml/L range, these become lowered from the bottom layer
oxygen demand by the time it enters the bay, particularly during summer. This demand stems from
the build-up of phytoplankton detritus in both the coastal sediments and near bottom layer. Thus
oxygen concentrations in the bay typically fall from spring maxima of 4 ml/L to late summer minima
of <0.5 ml/L (CSIR 2000). While `in-bay' oxygen demand does not exert such a large overall effect,
local hot-spot areas have been listed, such as the yacht club basin beside Saldanha and beneath intense
mussel farm areas (CSIR 2000). The bay is therefore vulnerable to internal increases in oxygen
demand from any organic loading of sediments, particularly in late summer when its near-bottom
oxygen concentrations have already become marginal as a result of oxygen-depleted natural inflow.
Microbiological monitoring undertaken by CSIR (2000) shows that coliform counts can regularly
exceed recommended limits in Small Bay (near the Saldanha township) and other places where
summer tourism can cause excessive sewage influx. The results indicated that mussel farms are at risk
from shell-meat contamination and require careful monitoring, particularly from late spring to early
autumn.
31
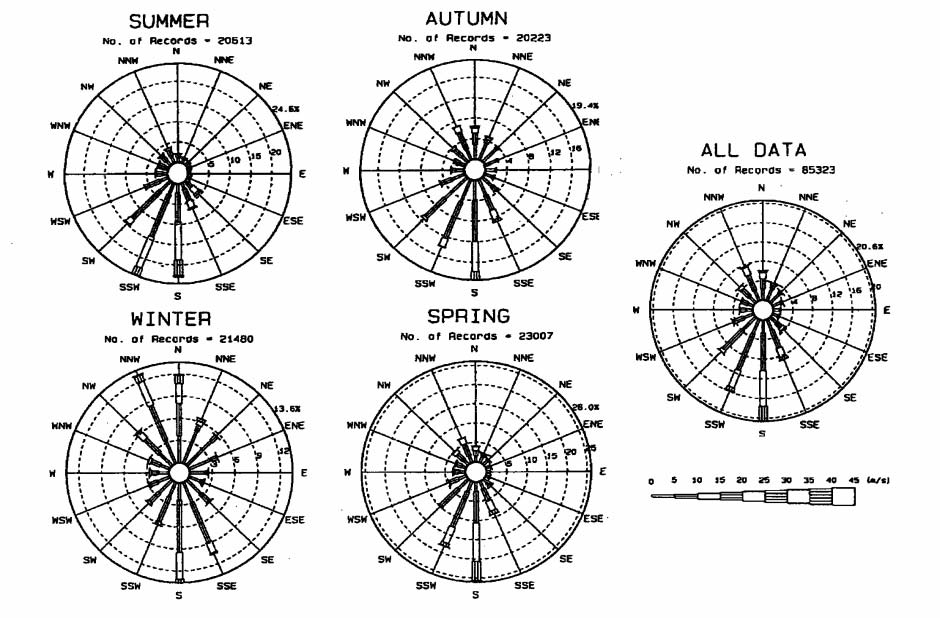
Ballast Water Risk Assessment, Port of Saldanha Bay, Republic of South Africa, November 2003: Final Report
A CSIR study commissioned by NPA and depicting 8 day pulses of cool upwellings into Saldanha
Bay was demonstrated to Group A by the CFP-A. The colour animations show the direction and bay-
wide spread and eventual dispersal of the upwelled cold water over a typical cycle, and had been
generated by temperature profiles and simple numerical modelling. The cool dense water rapidly
occupies the outer pier and anchorage area in the initial phase, owing to their proximity to the
entrance. To enable convenient launch via the GIS Port Map this file can be linked to ArcView files
by a piece of code added by the consultants. The cool temperature and density of this water
(compared to the warmer and much less dense BW likely to be discharged from visiting ships as a
result of solar and ship-induced tank heating), indicates that from late August to early May (i.e. 8-9
months of the year), the planktonic stages of benthic organisms released in BW discharges have
limited opportunity to reach the bottom substrates of the bay, and must wait until they are carried via
surface currents into shallow shoreline areas, i.e. where the thermocline and stratification breaks down
in waters <5-6 m deep.
Figure 11 shows median surface water current velocities measured in summer and winter in the
vicinity of the berthing areas. The plots indicate that current speeds are relatively weak throughout the
area (<0.5 km h-1), and fastest near the entrance and edges of the inner bay in both seasons (0.06 -
>0.12 m/s; Figure 11). The slowest surface currents occur in the centre of the bay beside the multi-
purpose terminal (<0.06 m/s; Figure 11), implying relatively slow dilution and dispersal of discharged
BW and associated organisms.
Figure 10. Seasonal and annual wind roses for Saldanha Bay based on 1995-1998 data (from a CSIR
Environmental study commissioned by NPA)
32
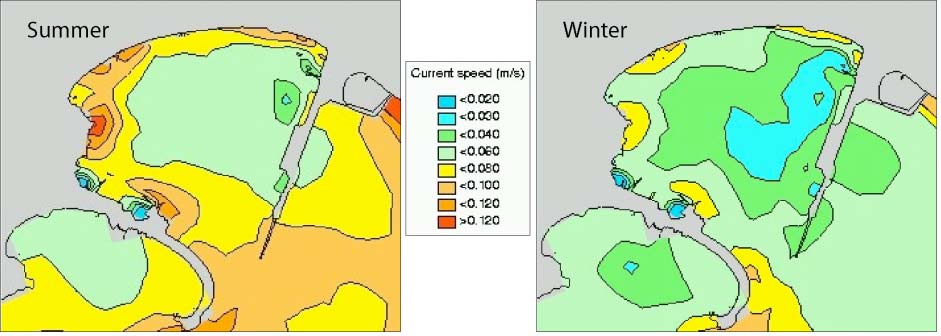
4 Results
Figure 11. Plots provided by NPA showing median current speeds in the surface depth layer in Saldanha Bay
during summer and winter
Port facilities and maintenance
As noted in Section 4.1, the first commercial port facilities in Saldanha Bay were not developed until
1974-75, and these provided a deep-water export terminal for iron ore which has been in use since
1976. An improved crude oil import facility for supplying the nation's 2 million barrel strategic oil
reserve was also completed. The oil reserve is located approximately 3 km inland of the bay, with
feeder pipelines to the refinery at Cape Town. During the 1980s a multi-purpose terminal was
subsequently developed on land reclaimed from dredging alongside the inshore portion of the iron ore
jetty, to provide berths for ships handling general cargo, lead and copper concentrates, plus rolled
steel and other products produced by the nearby Saldanha steelworks that was opened in 1996. The
port's three main berthing areas are therefore all located along the single, 2 km long pier that projects
into the deep, central part of bay from the north side and on the west side of the deep-water anchorage
(Figure 12).
The port's present-day entrance from the South Atlantic is bordered by Marcus Island and its artificial
sand-spit causeway on the west side, and the natural Rietbaai Peninsula on the east side (Figure 12).
After entering the bay between the small Malgas and Jutten Islands, ships follow a short and naturally
deep (>22 m) shipping channel to swinging areas alongside the long pier (only the swinging area of
the multi-purpose terminal is dredged; Figure 12). The pier, together with the causeway leading to
Marcus Island, has divided Saldanha Bay into three water bodies, i.e. the outer bay (which is very
much open coastal in character), `Big Bay' on the east side and `Small Bay' on the west side. The
latter comprises the most enclosed water body due to the gap between the pier and Marcus Island
Causeway (Figure 12).
Apart from the pier and its nearby anchorage, there is a shallow anchorage, jetty and wharf facilities
beside the small town of Saldanha in the south-west corner of Small Bay. These are used for fish
processing and exports, as well as providing lay-up and maintenance points for tugs, workboats,
fishing and recreational vessels (Figure 12).
Because of the naturally deep waters in Saldanha Bay, the only significant capital dredging was that
undertaken in the 1980s to develop the multi-purpose terminal and adjacent turning area. Repeat
dredging to maintain the design depths of the inshore berths and adjacent swinging area (up to 13 m
below LAT) has not yet been required, although some further development dredging was undertaken
in association with the 1996-1997 extension of the multi-purpose quay. Since completion of the
multipurpose terminal, the Port of Saldanha Bay has been operating four main berthing areas which
are shown in Figure 12 and described as follows:
33
Ballast Water Risk Assessment, Port of Saldanha Bay, Republic of South Africa, November 2003: Final Report
· Iron export terminal (berths OBS, OBL): these 525 m long berths are located on either side
of the outer section of the long pier, and provide room for two Cape-Class bulk carriers.
Water depth is 21.5 m and there are two mooring dolphins to facilitate berthing. Of the seven
conveyor belts on the 540 m long and 40 m wide stem of the import pier, three are dedicated
to coal import.
· Oil terminal (berth TB): this single berth is located on the outermost south-east side of the
pier, and can accommodate one laden VLCC (100,000 - 300,000 DWT) with a maximal
arrival draft of 20.5 m for the import of crude oil, mostly from the Persian Gulf, Nigeria or
Venezuela.
· Multi-purpose terminal (berths 201-204): This contains general cargo berths along a 624 m
quay that accommodates vessels up to 200 m LOA and 13 m maximum draft, with a dredged
285m diameter turning basin situated next to the quay that is connected to deep water by a
dredged approach channel that runs parallel to the pier. This berth is served by 2 x 15 tonne
wharf cranes and typically handles geared bulk carriers, general cargo ships and ro-ro vessels,
plus casualties from winter gales. Most trade comprises the export of lead, copper and zinc
concentrates, zircon, rutile and titanium mineral sands and slag, rolled steel and other
products. Importations are mainly break-bulk and bulk cargos for the local steel works and
industry requirements.
· Sea Harvest/Cold Store terminal: This accommodates 6.5 m draft vessels loading frozen
fish which are berthed opposite the Sea Harvest Corporation cold store.
Small vessel facilities are located beside the Sea Harvest terminal. These comprise the 360 m long
Government jetty used mostly by fishing vessels (maximum draft 6.5m), plus a slipway jetty that can
accommodate vessels up to 1,200 tonne, 70 m LOA and 5 m draft and equipped with one 10 tonne
crane. The adjacent Portnet small boat harbour (225 m, draft 5.5 m) is used mainly for the berthing
and maintenance of Portnet workboats and tugs. The Mossgas quay can accept vessels with drafts up
to 6 m. The port provides limited bunkering and waste reception services. Heavy fuel oil is not
available, while gas and diesel delivered to the ore berths are supplied from drums and road tankers
based in Cape Town. Private refuelling lines are used at the Sea Harvest quay and government jetty.
Figure 12. Part of the GIS Port Map of Saldanha Bay showing the navigation, infrastructure and active berth
layers.
34
4 Results
4.2 Resource
mapping
As shown by the habitat layer of the GIS port map (Figure 13), the subtidal seafloor habitats in
Saldanha Bay are dominated by sand sheets and rocky substrates which are covered in macroalgae
that develop rapidly each spring. The connecting Langebaan Lagoon is shallow (6-7 m maximum
depth) and completely sheltered from wave action, and it contains sand beaches and salt marshes
without significant freshwater inflows, plus well developed seagrass meadows near its mouth (Figure
13). It is likely there are some significant areas of seagrass in parts of Saldanha Bay, but no
information could be found to delineate where these are most extensive. The intertidal habitats of
Saldanha Bay are shown in Figure 13 and comprise the following:
· Narrow natural rocky shores and cliffs;
· Sand beaches along the Marcus Island causeway, around the bay and in the Langebaan
Lagoon; and
· High tidal marshes and low intertidal mud flats in the Langebaan Lagoon.
Artificial smooth and rocky wall substrates are restricted to the main pier and the Sea Harvest/Cold
Store wharf and government jetty facilities beside the town of Saldanha. There are no coral reefs or
mangroves in this temperate region of Africa (the nearest are located to the north-east near Durban,
and under the influence of the warm southward flowing Agulhas Current). There are three designated
mariculture areas in Saldanha Bay, while the boundaries of the West Coast National Park encapsulate
most of the Langebaan Lagoon and part of the open coastline south of the entrance to Saldanha Bay
(Figure 13).
The GIS port map also shows the locations of the 39 PBBS sampling sites (Figure 13). These were
provided so that the results of the final PBBS report can be linked to port map for convenient display.
Because of the scale of the map and the extent of the urban and other developed areas, individual
features such as post offices, churches and radio masts were not added. No historical wrecks of
archaeological or cultural-heritage value could be precisely located in the area covered by the GIS
port map.
Saldanha Bay's protection and close link to the highly productive Benguela upwelling system
provides optimal habitats, nutrients and temperatures for mussel farming and other aquaculture
ventures (Pitcher et al. 1999). This fledgling but potentially large and lucrative shellfish farming
industry has to conform to tight water quality constraints imposed by export markets. However the
marked increase in human activities, including the physiographic imposition of the large pier, have
altered the water quality, sediment and ecological characteristics of the system.
Changes since the 1970s include eutrophication problems from increased part-treated sewage
discharge and other outfalls, leading to phytoplankton blooms, increased hypoxic events (oxygen
depletion), organic sediment enrichment, sulphide formation, and a rise in sediment metal
accumulations and other pollutants originating from the various industrial, urban residential, port and
shipping discharges and run-off. Close coexistence of port, industrial, mariculture, recreational,
tourism and wildlife conservation requirements and activities in Saldanha Bay have provided a
challenge that is continuing to be met by the Saldanha Bay Water Quality Forum, established to
provide for orderly consultations among and between the various stakeholders, authorities and
government agencies.
35
Ballast Water Risk Assessment, Port of Saldanha Bay, Republic of South Africa, November 2003: Final Report
Figure 13. Part of the GIS Port Map showing the marine habitats and reserve layers
4.3 De-ballasting/ballasting
patterns
The port's navigational rules and requirements and local metocean conditions which influence the
deballasting/ballasting practises of arriving vessels were discussed during the port meeting in April
2002. The port limits extend 3 nautical miles (nM) seaward from the north and south sides of the
entrance. Pilotage is compulsory for all vessels, with pilots boarding laden and partly laden vessels 3
nM off North Head, while vessels in light or ballasted conditions are usually boarded 2 nM off. Laden
oil tankers must remain 6 nM off the coast until the confirmed pilot boarding time and location. Tugs
usually meet incoming vessels approx 1 nM seaward of the entrance channel (four tugs are used for
laden arriving oil tankers and three for laden departing iron ore carriers).
The depth of the approach channel immediately seaward of the pier is 23 m, reaching 24 m at the start
of the entrance channel, which has a width of 400 m at its narrowest point. The port is periodically
affected by heavy swells, particularly in the winter months (swells in the entrance channel can exceed
7.0 m during spring high tides) and its anchorage is very poor. The NPA does not recommend
anchoring other than at the much safer anchorage in St Helena Bay (located 4 hours steaming north-
east of Saldanha Bay). Large winter swells can also affect ships on the pier, causing them to damage
fenders and break lines. In extreme cases ships have had to be taken off their berth and stood out to
sea. The NPA therefore requires visiting ships not to immobilise their engines without written
permission from the Port Captain, and a sufficient crew must always be kept on board.
Once inside the bay, vessels which arrive in ballast during heavy swell periods (e.g. from a winter
storm front), begin to release any heavy weather ballast they had taken up in the open ocean to
improve stability. As in other ports, the port and pilotage rules require all (cargo) empty ships to retain
sufficient ballast on board to maintain adequate propulsion and steerage control, and to minimise
36
4 Results
windage until berthing is completed. Windage can be significant in both summer and winter months
due to the strength of the SE and NNE winds and occasional SW fronts.
The database record demonstrated a relatively consistent and slightly increasing trade of 25-35 ships
per month for the 1999-2002 period (Figure 14). It was not difficult to establish the main
deballasting/ballasting pattern for these arrivals because of the short entrance channel to Saldanha
Bay, the exposed nature of its deepwater anchorage, and the location of its iron ore export berths,
crude oil import berths (no crude has been exported from the reserve since October 1999), and
generally export-oriented multipurpose terminal (which mostly trades export steel and metalliferous
products; see below).
Thus most BW is discharged at or close to the main pier. Ships which do temporarily anchor in the
bay (typically for 24-36 hours) generally retain between 80-95% of their normal ballast due to local
windage and the potential need to move quickly seaward if swells increase. By contrast, the oil
tankers are either fully or sufficiently loaded with cargo to have negligible BW on board. These
vessels have no requirement to uplift any ballast water until well after they have berthed and started
discharging their cargo.
While it was straightforward to identify the ballasting/deballasting locations of the iron ore carriers
and tankers, this was not case for all vessels berthing at the multi-purpose terminal. A significant
percentage of the general cargo ships, bulk carriers and the occasional Ro-Ro vessel visiting this
terminal were part-loaded with cargo, some or all of which was destined for either :
· loading additional cargo (i.e. requiring no or relatively small releases of BW), or
· unloading cargo (i.e. possible ballast water uptake);
· both (an operation that can require a vessel to discharge BW water to maintain trim during
part of its cargo unloading /loading cycle).
Thus unless these vessels submit reasonably complete BWRFs, it is not possible to estimate what
ballast may have been taken up or released owing to the lack of information concerning the amount of
cargo and BW already on board. Since BWRFs were obtained only for the last three months, and
since these do not contain information on ballast water uptakes, the ballasting/deballasting picture for
this terminal remained imprecise, alhough it was clear that, overall, BW discharges exceed BW
uptakes by a substantial margin.
Of the total of 1315 vessel visits entered into the database by the end of the second consultants visit,
the majority were based on the Excel spreadsheet records for 1999-2002. The following statistics were
obtained from the Access database:
· For the 82 visits at the oil terminal in January 1999 - June 2002 database, the majority were
laden VLCCs arriving at rates of 1-4 per month from the Gulf and Nigerian oil export
terminals, including the largest which were the Napa (285,640 DWT) from the Gulf oil
terminal Ras Tanura, and the Crown Unity (300,482 DWT) from an unknown terminal. The
total reported BW discharged in the fading period of crude oil exports (i.e. January - October
1999) was 1,269,137 tonnes.
· For the 593 visits to the iron ore export terminal, the vast majority were Cape Class bulk
carriers in the 130,000 200,000 DWT range (the largest being the Arcturus at 251,19 DWT).
The total reported BW discharged in the January 1999 June 2002 period was 26,802,325
tonnes.
· For the 607 visits entered for the multi-purpose terminal, the vast majority were 17,000 -
50,000 DWT dry bulk carriers (338), and 11,000 40,000 DWT general cargo ships (241).
Total recorded BW discharges amounted to 1,576,292 tonnes.
37
Ballast Water Risk Assessment, Port of Saldanha Bay, Republic of South Africa, November 2003: Final Report
· For the 33 visits to the Sea Harvest/Cold Store terminal, these were small reefers in the 1,000
- 4,200 DWT range, only one of which reported a total of 200 tonnes of discharged BW trim
water.
The database stores the amounts and sources of BW discharged from these arrivals, as entered from
the NPA records (1999-2002) and April-June 2002 BWRFs. Connection of the active berth layer of
the GIS Port Map to the database allowed tables summarising the BW discharge statistics to be
conveniently displayed for each terminal. Examples of these tables displayed by the GIS Port Map are
shown for the iron ore, multi-purpose and oil terminals in Figures 14, 15 and 16 respectively.
Because the database must accept and manage individual tank discharges as discrete units (as
recorded in IMO-standard BWRFs; Appendix 1), the need to treat all BW tanks as a single entity for
all vessels arriving prior to BWRF use (or which submitted incomplete BWRFs; Section 3.6) reduces
the number of individual tank discharges actually made in January 1999-June 2002, and inflates the
mean and maximum tank discharge volumes. Thus the latter can reflect the total BW capacity of the
largest visiting vessels (Figures 15-17), which causes a more conservative outcome in terms of the
BWRA results. It is worth emphasising that a database containing individual tank data collated from,
say, a 12 month set of fully completed BWRFs, will generate far more precise BW source port values
for the C1, C2 and R1 components (Section 3.10).
Vessel Visit Record
45
40
35
30
No. of visits
25
20
15
0
5
10
15
20
25
30
35
40
45
Month (1/99 - 6/02)
Figure 14. Rate of monthly vessel visits in the Saldanha Bay database
38
4 Results
Figure 15. BW discharge statistics displayed by GIS Port Map for the ore export terminal.
Figure 16. BW discharge statistics displayed by GIS Port Map for the multi-purpose terminal
39
Ballast Water Risk Assessment, Port of Saldanha Bay, Republic of South Africa, November 2003: Final Report
Figure 17. BW discharge statistics displayed by GIS Port Map for the oil terminal
4.4 Identification of source ports
From the 1315 vessel visit records and 1307 associated BW discharges in the Saldanha database, the
total number of identified BW source ports was 131 (Table 3). Figure 18 shows output from the GIS
world bioregion map depicting the location and relative importance of these source ports with respect
to C1 (BW discharge frequency). As with all GIS outputs, the map is `zoomable' to allow all ports
and symbols to be clearly delineated at smaller scales.
The frequency values for the 131 identified source ports listed in Table 3 are the C1 coefficients used
to calculate the relative overall risk (Section 3.10). The source port `supplying' the highest frequency
of BW discharges at Saldanha Bay was Durban (9.2%), which was closely followed by Richards Bay
(9.1%). This was followed by Rotterdam 5.1% and Port Talbot in the United Kingdom 4.1%.
Of the 131 identified source ports, the top 13 provided 50% of the source-identified discharges, while
the next 23 ports contributed a further 25%, i.e. only 36 of all source ports (27.3%) accounted for 75%
of the total number of source-identified BW discharges (Table 3). As noted earlier, the low number of
individual tank discharges (1307) compared to the visits (1315), is due to (a) the need to include port
shipping records prior to the regular use of BWRFs (all tanks combined), and (b) most vessels
submitted a single, total discharge volume covering all their tanks on the BWRF.
The total volume of BW discharged from identified source ports of the 1315 vessel visits recorded in
1999-2002 was 29,647,954 tonnes. The various discharge percentages for each source port in Table 3
and Figure 19 provide the C2 (BW discharge volume) values used in the risk calculation (Section
3.10).
40
4 Results
The port rankings for C2 were similar but not the same as those for C1 (as ranked in Table 3). The
source ports providing the largest volume of BW discharged at Saldanha were Rotterdam (2,176,478
tonnes; 7.3%) and Port Talbot (1,930,279 tonnes; 6.5%), followed by Singapore (1,480,113; 5.0%) and
Immingham (1,239,844 tonnes; 4.2%; Table 3).
The top 13 of identified source ports provided 50% of the total discharged volume, and the next 17
ports a further 25%. Thus only 30 (22.7%) of all identified source ports accounted for 75% of the
source-identified BW discharged at Saldanha Bay. Of the top 20 ports in terms of total discharge
volume (64% of C2), three were in the Netherlands and three in China, two were in France, Japan,
United Kingdom, and one each in Australia, Belgium, Germany, Israel, Italy, South Africa and Spain
(Table 3).
Figure 18. GIS output showing location and relative importance of BW source ports with respect to frequency of
tank discharges (C1) at Port of Saldanha Bay.
Figure 19. GIS output showing location and relative importance of the source ports with respect to the volume of
tank discharges (C2) at Port of Saldanha Bay
41
Ballast Water Risk Assessment, Port of Saldanha Bay, Republic of South Africa, November 2003: Final Report
Table 3. List of identified source ports in the Port of Saldanha Bay database, showing proportions of recorded
ballast tank discharges (C1) and volumes (C2)*
*C1 = proportion of all discharges (% of all discharges); C2 = proportion of total discharge volume (%)
42
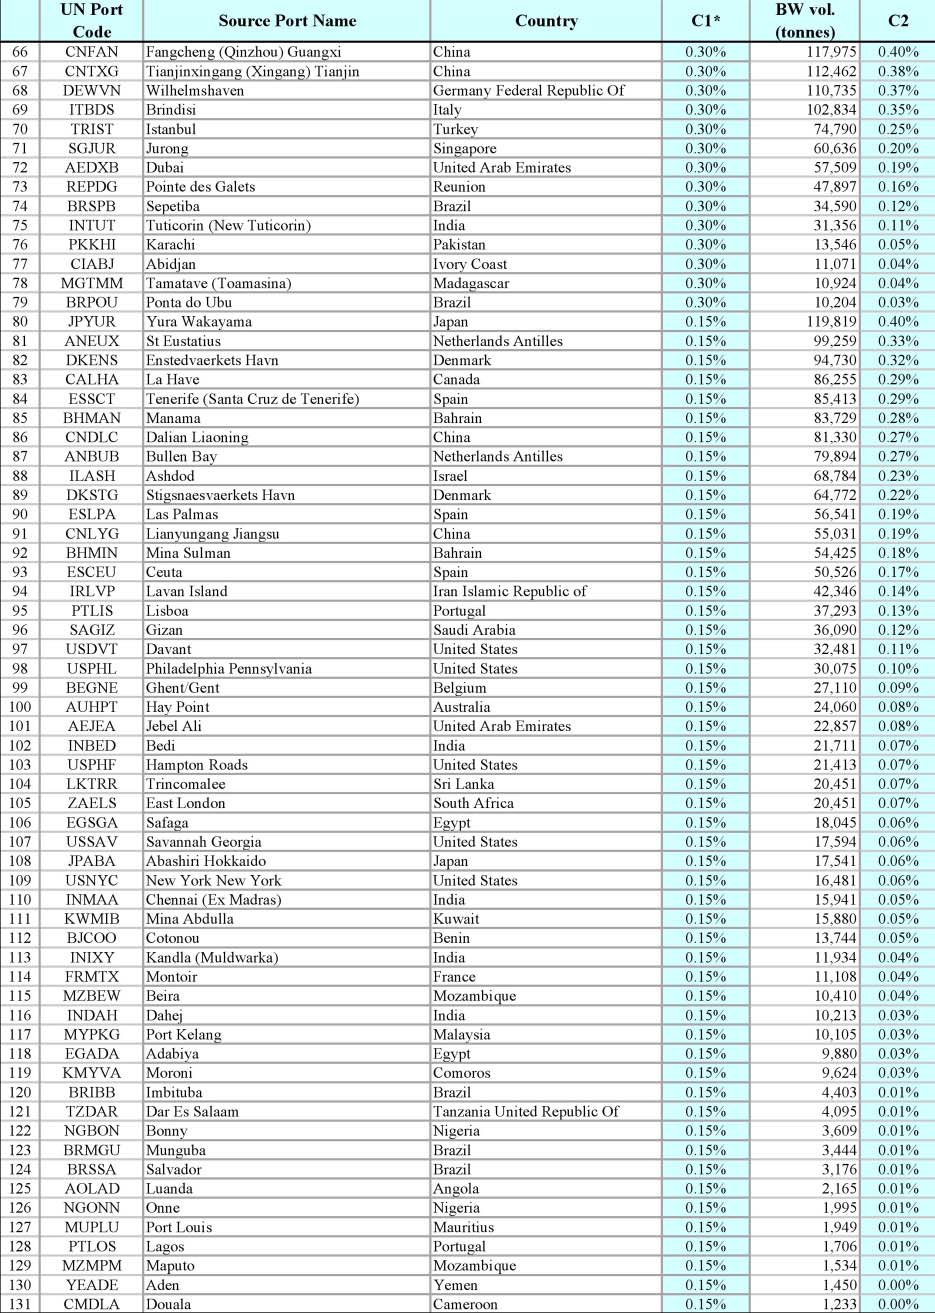
4 Results
Table 3 (cont'd). List of identified source ports in the Port of Saldanha Bay database, showing proportions of
recorded ballast tank discharges (C1) and volumes (C2)*
*C1 = proportion of all discharges (% of all discharges); C2 = proportion of total discharge volume (%)
43
Ballast Water Risk Assessment, Port of Saldanha Bay, Republic of South Africa, November 2003: Final Report
4.5 Identification of destination ports
As discussed in Section 3.5, identification of destination ports for any BW taken up at a
Demonstration Site is confounded by the lack specific questions on the BWRF, and the uncertainty of
knowing if the Next of Port Call recorded on a BWRF (or in a shipping record) is where BW is
actually discharged. Thus presently there is no reporting mechanism enabling a `reverse BWRA' to be
undertaken reliably. This posed an issue for vessels departing the oil terminal and multipurpose berths,
after uplifting BW alongside these berths.
Of the 183 possible BW destination ports (i.e. Next Ports of Call) in the 1999-2002 database, their
location and proportional frequency are shown Figure 20 and listed in Table 4. The latter lists the top
33 destination ports that accounted for 75% of the recorded Next Ports of Call by all 1315 vessel
departures. Table 4 also that many of the most frequent BW source ports were also very frequent
destination ports, with over 33% of Next Ports of Call attributed to the ports of Durban, Beilun,
Singapore, Rotterdam and Richards Bay (Figure 20).
Table 4 shows that of the 33 ports reported as the destinations of 75% of the vessels departing
Saldanha Bay, twelve of these were in Western Europe, ten in East Asia, six in southern Africa, two
in South America and one in North America.
Figure 20. GIS output showing location and frequency of destination ports, recorded as the Next Port of Call in
the Port of Saldanha Bay BWRFs and shipping records.
44
4 Results
Table 4. Destination ports accounting for >80% of all vessel departures from Saldanha Bay in 1998-2002
(recorded as Next Ports of Call)
4.6
Environmental similarity analysis
Of the identified 131 source ports and 183 destination ports, sufficient port environmental data were
obtained to include 71% of the former and 51% of the latter in the multivariate similarity analysis by
PRIMER. These ports accounted for 90% of all recorded BW discharges and 84.5% of all recorded
departures respectively (Tables 5-6). Details of the 357 ports included in the multivariate analysis
carried out for Saldanha Bay and the other Demonstration Site BWRAs are listed in Appendix 6 (this
list is ordered alphabetically using the UN port identification code, in which the first two letters
represent the country).
To allow all identified BW source and next ports of Saldanha Bay to be part of the `first-pass' risk
assessment, those ports not included in the multivariate analysis were provided with environment
matching coefficient estimates, and are noted as such in the database. The C3 estimates were based on
their port type (Section 3.7) and geographic location with respect to the nearest comparable ports for
which C3 had been calculated. A precautionary approach was adopted (i.e. the estimated values were
made higher than the calculated C3s of the comparable ports). Providing C3 estimates allowed the
database to include all of source ports and next ports when calculating the ROR values and displaying
the BWRA results.
The GIS world map outputs that display the C3 values of the Port of Saldanha source and destination
ports are in Figures 21 and 22 respectively. These plots and Tables 5-6 show that the port has a
45
Ballast Water Risk Assessment, Port of Saldanha Bay, Republic of South Africa, November 2003: Final Report
relatively high environmental similarity to a large number of its trading ports in the Mediterranean
(i.e. C3s in the 0.6 - 0.8 range). This can be related to its geographical location, providing a broad
range of its temperature regime due to upwelling events, plus a moderate annual of rainfall.
The most environmentally similar BW source port to Saldanha Bay was Piraeus in Greece (C3 =
0.777). This port was accompanied by 11 other widely distributed source ports having either
calculated or estimated C3 matching coefficients above 0.7 (Table 5). Another widely dispersed group
of ports (37) had relatively high C3 values in the 0.6-0.7 range (Table 5). The most environmentally
dissimilar ports trading with Saldanha Bay in 1999-2002 were a mixture of cool water and brackish
ports, Persian Gulf ports and ports in the humid tropics (Tables 5-6; Figures 21, 22).
As discussed in Section 4.6 and highlighted in Figure 20, the most frequent recorded next port of call
was Durban (8.9% of all departures) and Beilun (Ningbo) in north-east China (8.5%), and these had
relatively high (0.643) and moderate (0.580) environmental matching coefficients respectively (Table
6). While San Antonio had the highest environmental match (0.80), it was an infrequent next port of
call (0.54% of all departures) and was not reported as a BW source port (Tables 3, 4).
Figure 21. GIS output showing the location and environmental matching coefficients (C3) of BW source ports
identified for the Port of Saldanha Bay
Figure 22. GIS output showing the location and environmental matching coefficients (C3) of the destination ports
identified for the Port of Saldanha Bay
46
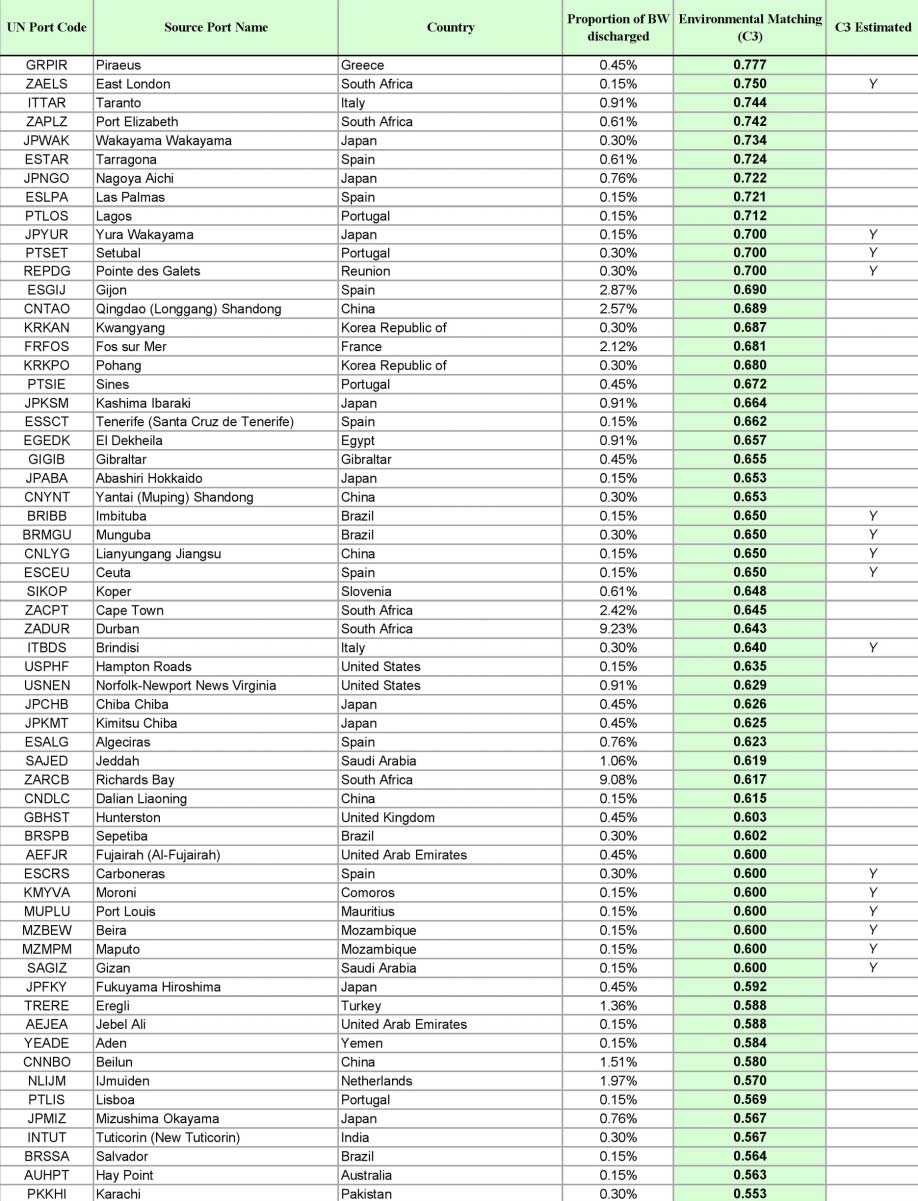
4 Results
Table 5. Source ports identified for Port of Saldanha Bay, as ranked according to size of their environmental
matching coefficient (C3)
47
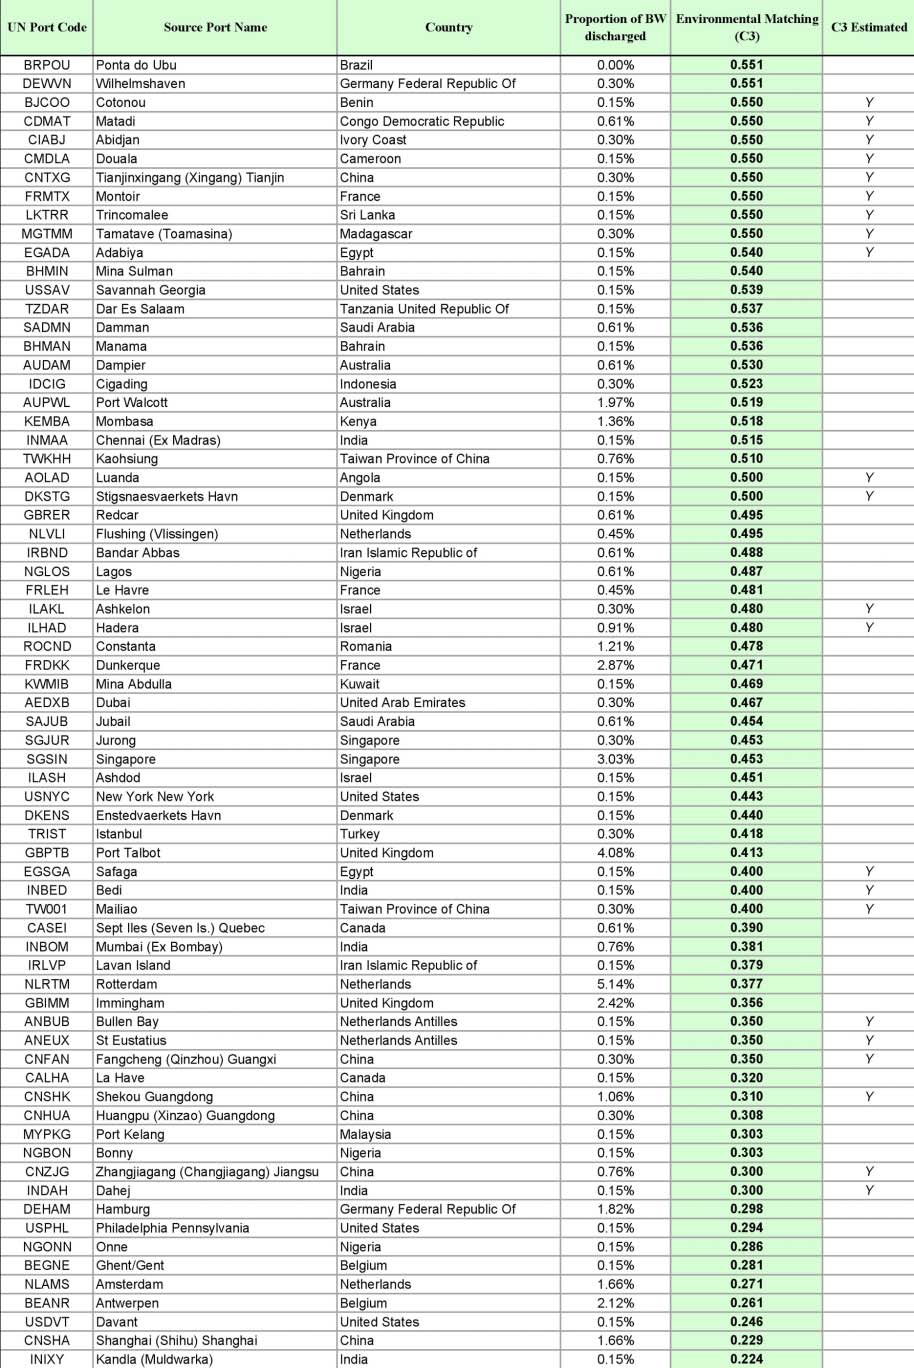
Ballast Water Risk Assessment, Port of Saldanha Bay, Republic of South Africa, November 2003: Final Report
Table 5 (cont'd). Source ports identified for Port of Saldanha Bay, as ranked according to size of their
environmental matching coefficient (C3)
48
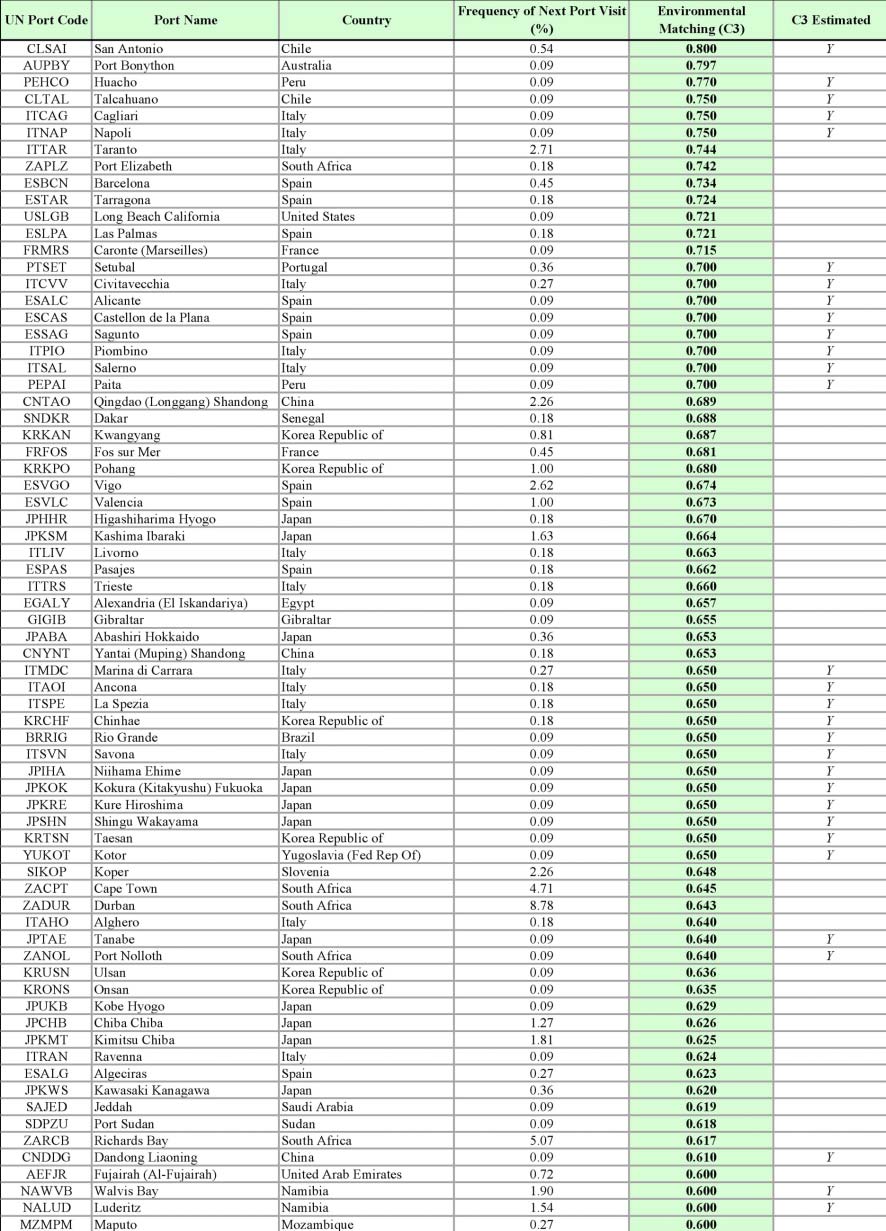
4 Results
Table 6. Destination ports identified for Port of Saldanha Bay, ranked according to the size of their environmental
matching coefficient (C3)
49
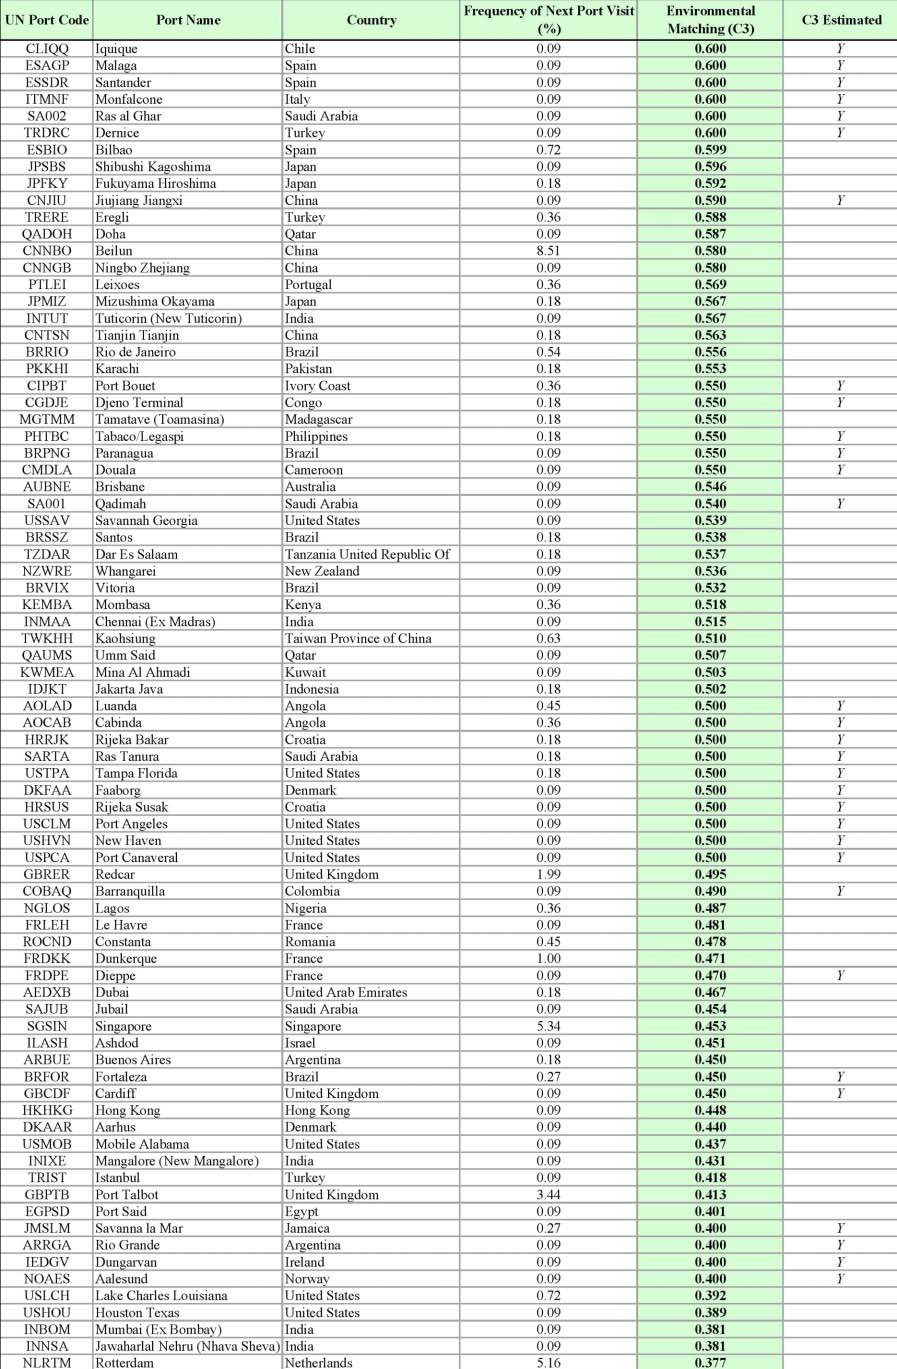
Ballast Water Risk Assessment, Port of Saldanha Bay, Republic of South Africa, November 2003: Final Report
Table 6 (cont'd). Destination ports identified for Port of Saldanha Bay, ranked according to the size of their
environmental matching coefficient (C3)
50
4 Results
4.7
Risk species
The risk species threat from a source port depends on the number of introduced and native species in
its bioregion, and their categorisation as either an unlikely, suspected or known harmful species
(Section 3.9).
The risk species threat coefficient (C4) of each BW source port identified for Saldanha Bay are shown
in Figure 23 and listed in Table 7. Table 8 also lists the scores for the introduced, suspected and
known harmful species of the source port bioregions, as had been added and assigned to the
database's species tables by February 2003.
As noted in Section 3.9, these tables and their associated Excel species reference file do not give a
complete global list, but provide a working resource enabling convenient update and improvement for
each bioregion. Similarly, the 204 bioregions on the GIS world map should not be considered
unalterable. Regional resolution of species-presence records is steadily improving in several areas,
and this will allow many bioregions to become divided into increasingly smaller units (ultimately
approaching the scale of local port waters). It should also be recognised that the distribution of risk
species in the database also contains a regional bias due to the level of aquatic sampling and
taxonomic effort in Australia/New Zealand, Europe and North America.
The species in Table 8 include preliminary identifications from the Saldanha Bay PBBS, plus those
listed in published and unpublished reports collated by Group C members (Appendix 5). Many of the
species listed in the database can be related to their history of species transfers for aquaculture, plus
hull fouling on sailing vessels and the canal-caused invasions of the east Mediterranean (Suez), north-
east Europe (Ponto-Caspian river canal links) and Great Lakes (St Lawrence River seaway). The
regional and often patchy sampling bias needs to be remembered when comparing C4 values between
different bioregions, and is a further reason why the independent treatment of C3 for calculating the
ROR values is a safer approach (Section 3.10).
Because of the different historical vectors (hull fouling, canals, aquaculture, dry ballast, water ballast,
etc), a future version of the BWRA system could provide more accurate C4 values for BW-mediated
introduction threats if vector weightings are added to the database for the C4 calculation. Finally, it is
worth noting the database cannot produce `reverse' C4 values for destination ports (i.e. measures of
the relative threat posed by any BW exported from Saldanha Bay). This requires knowing the sources
of all the other BW discharged at each destination port. What can be extracted from the database to
assist a `reverse' BWRA is the list of species assigned to the bioregion of WA-IV (which is located
very near its boundary with WA-V; Figure 7, Table 8).
Figure 23. GIS output showing the location and risk species threat coefficients (C4) of the BW source ports
identified for the Port of Saldanha Bay
51
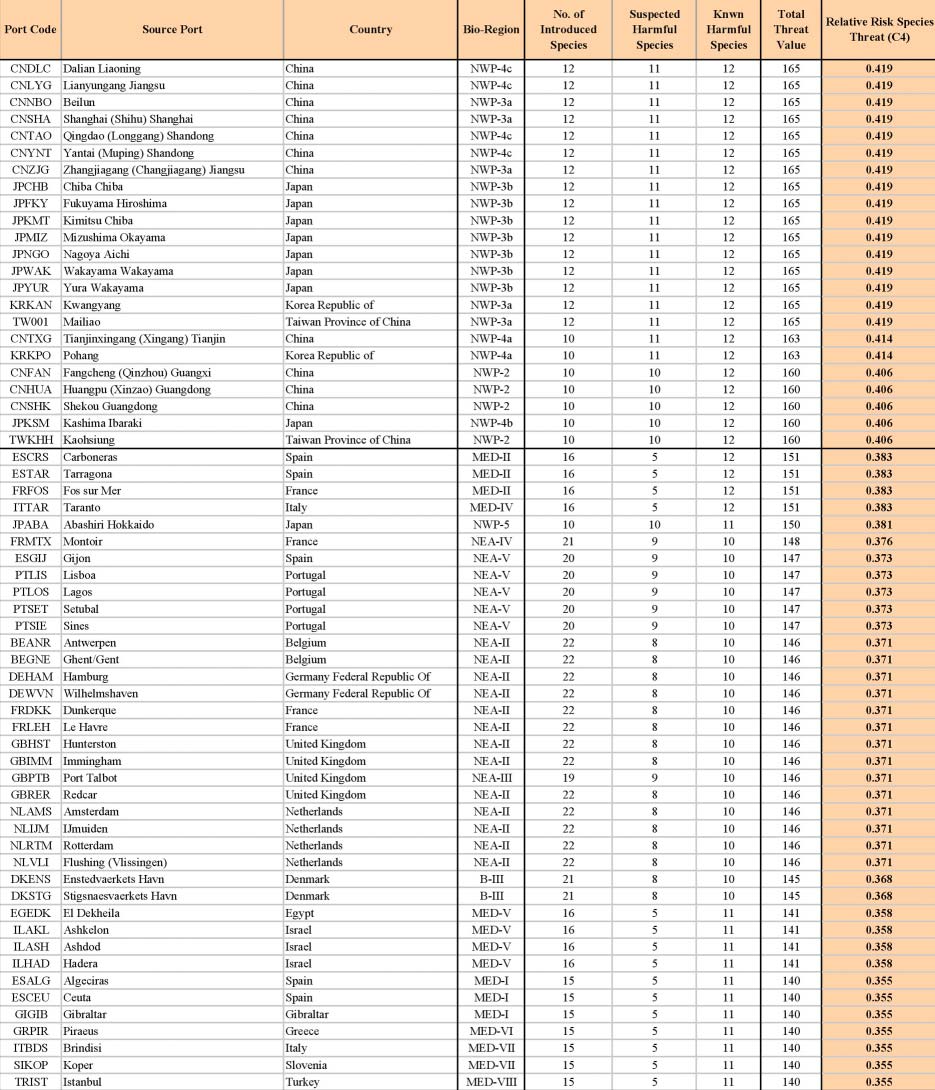
Ballast Water Risk Assessment, Port of Saldanha Bay, Republic of South Africa, November 2003: Final Report
Table 7. Ranking of BW source ports identified for Port of Saldanha Bay, according to the size of their risk
species threat (C4)
52
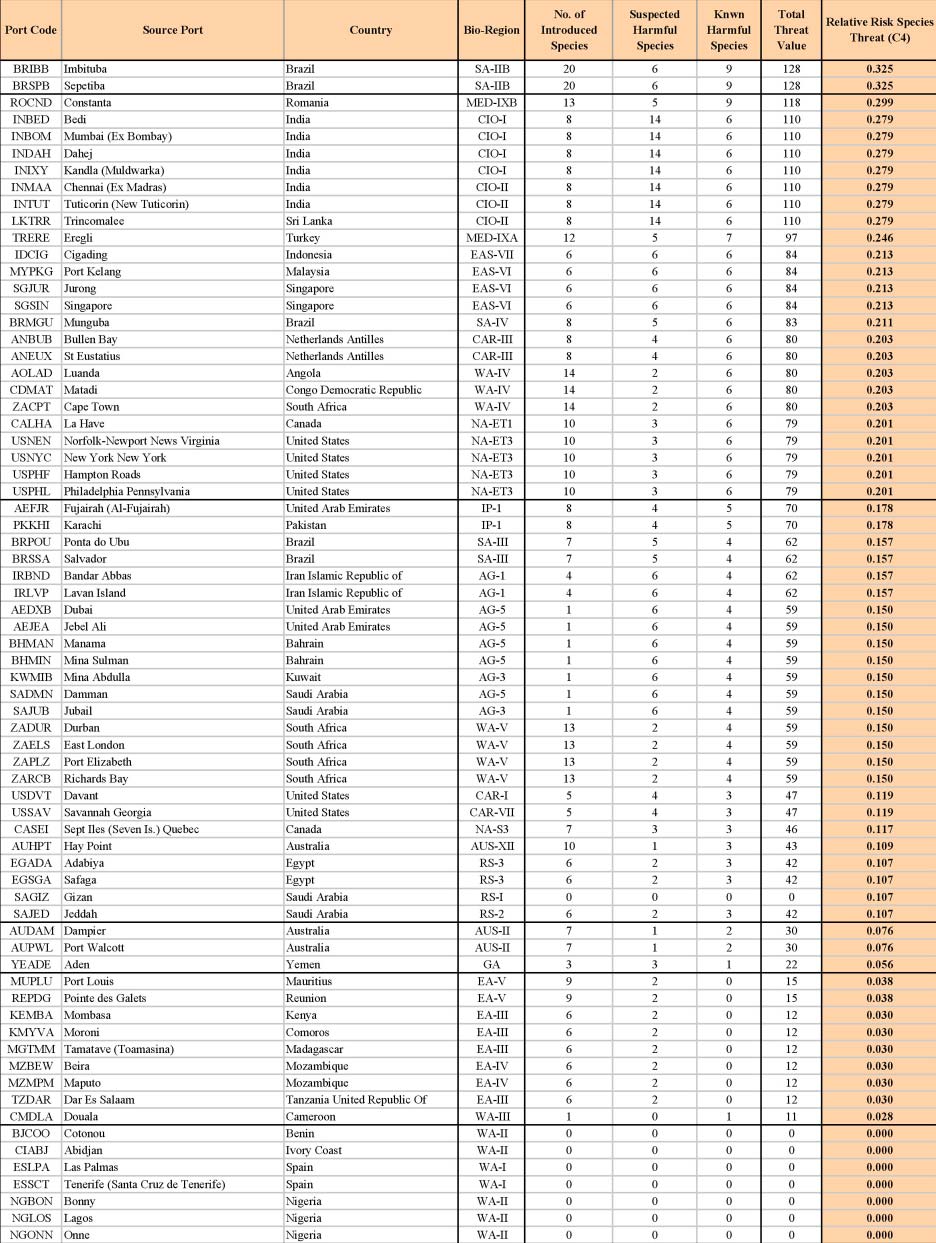
4 Results
Table 7 (cont'd). Ranking of BW source ports identified for Port of Saldanha Bay, according to the size of their
risk species threat (C4)
53
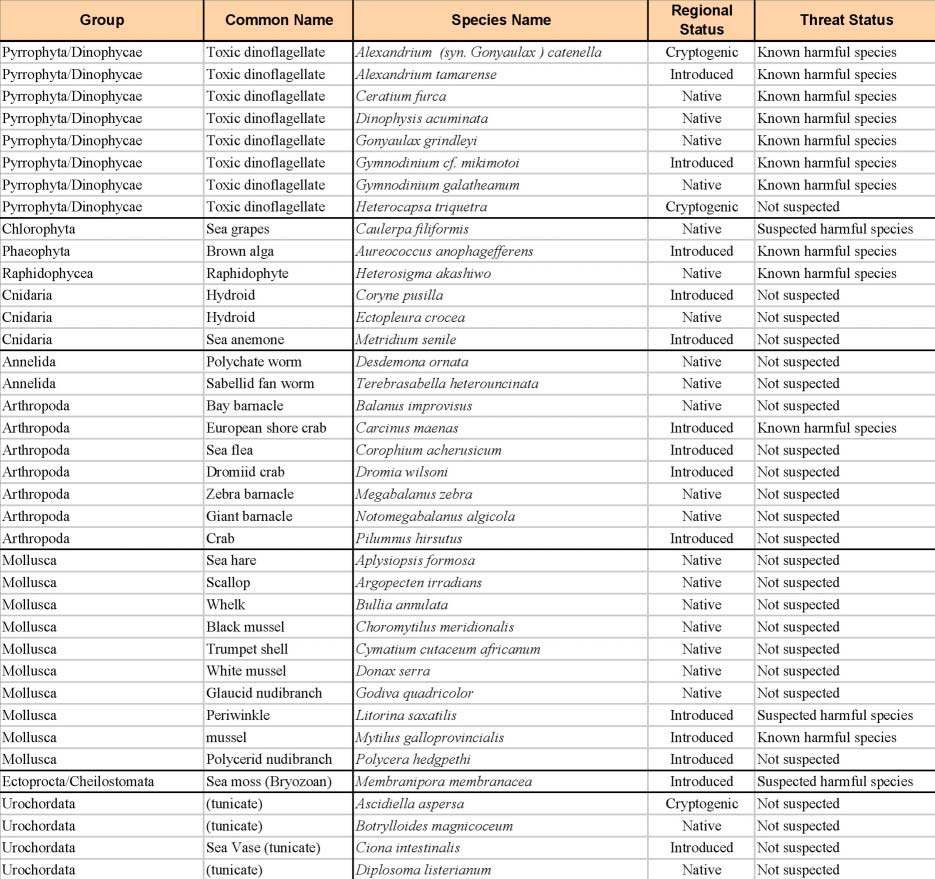
Ballast Water Risk Assessment, Port of Saldanha Bay, Republic of South Africa, November 2003: Final Report
Table 8. Status of risk species assigned to the bioregion of Saldanha Bay (WA-IV)
4.8
Risk assessment results
The database calculates the relative overall risk (ROR) of a potentially harmful introduction for all
source ports that have C1-C4 coefficients and R1-R2 factors. The ROR value for each source port
represents a proportion of the threat posed to the Demonstration Site as result of its contemporary
trading pattern (1999-2002).
After calculating the RORs the database generates a large output table listing the source ports and
their coefficients, risk-reduction factors and ROR, plus its assignment into one of the five ROR
categories used for the GIS plot and its standardised ROR value (S-ROR; Section 3.10). Results from
the project-standard BWRA for the Port of Saldanha Bay are listed in Table 9, and the GIS plot of the
categorised RORs is shown in Figure 24.
From the 1315 visit records in the Saldanha database, the project standard identified 19 of the 131
source ports as representing the highest risk group (in terms of their BW source frequency, volume,
environmental similarity and assigned risk species). These ports provided the top 20% of the total
ROR, with individual values in the 0.21 - 0.25 range (Table 9). They were predominantly
Mediterranean, South African and North Asian ports, led by Piraeus in Greece (ROR = 0.250;
54
4 Results
S-ROR = 1.00), Taranto in Italy (ROR = 0.247 S-ROR = 0.997) and Gijon in Spain (0.245; S-ROR =
0.970; Table 9). The next group of high risk ports (22) were predominantly north Asian and Brazilian,
with seven European ports (Table 9). The 41 highest risk and high risk ports comprised 31% of the
total number of identified source ports.
The BW source ports in the low (28) and lowest (37) risk categories comprised 50% of the identified
source ports, and these were a mixture of cool, warm and/or brackish water ports with a global
distribution (Figure 24). The source port with the lowest ROR (0.07; S-ROR = 0.0) was the wet
tropics port of Onne on the Nigerian coast (Table 9; Figure 24).
Based on the 1999-2002 pattern of shipping trade, the ROR results show that BW discharged from
vessels arriving from the temperate and warm temperate open coastal ports in the Mediterranean and
north Asian regions pose considerably more threat than those in the wet tropics and north American
seaboard.
The results shown in Table 9 and Figure 24 are logical given Saldanha's biogeographic location,
current pattern of trade and port type (a natural bay port). They also fit with the origins of the
introduced species already present in Saldanha Bay (i.e. introductions from Europe and East Asia).
The results therefore indicate that the project standard `first-pass' treatment of the risk coefficients
provides a useful benchmark for any investigative manipulation of the risk calculations and database.
The exposed and relatively rugged open coastlines of South Africa have not experienced the level of
harmful invasive species seen in other regions. However the number of noxious phytoplankton
species in Table 9 and recent history of bloom events shows that its enclosed bays and lagoons such
as the Saldanha-Langebaan system are not immune to red tides caused by introduced species, as well
as those which can be generated by native species as a result of natural upwelling and/or
eutrophication in developed areas. It is also not yet clear if potentially harmful macrobenthic fauna
such as Carcinus maenas may eventually spread by natural or vessel-mediated means into preferred
sheltered rocky areas such as inside the entrance to Saldanha Bay.
Figure 25 shows the frequency distribution of the standardised ROR values. The relatively uniform
shape of this plot shows there were no significant groupings of particularly high or low risk ports.
Figure 24. GIS output showing the location and categories of relative overall risk (ROR) of source ports identified
for the Port of Saldanha Bay
55
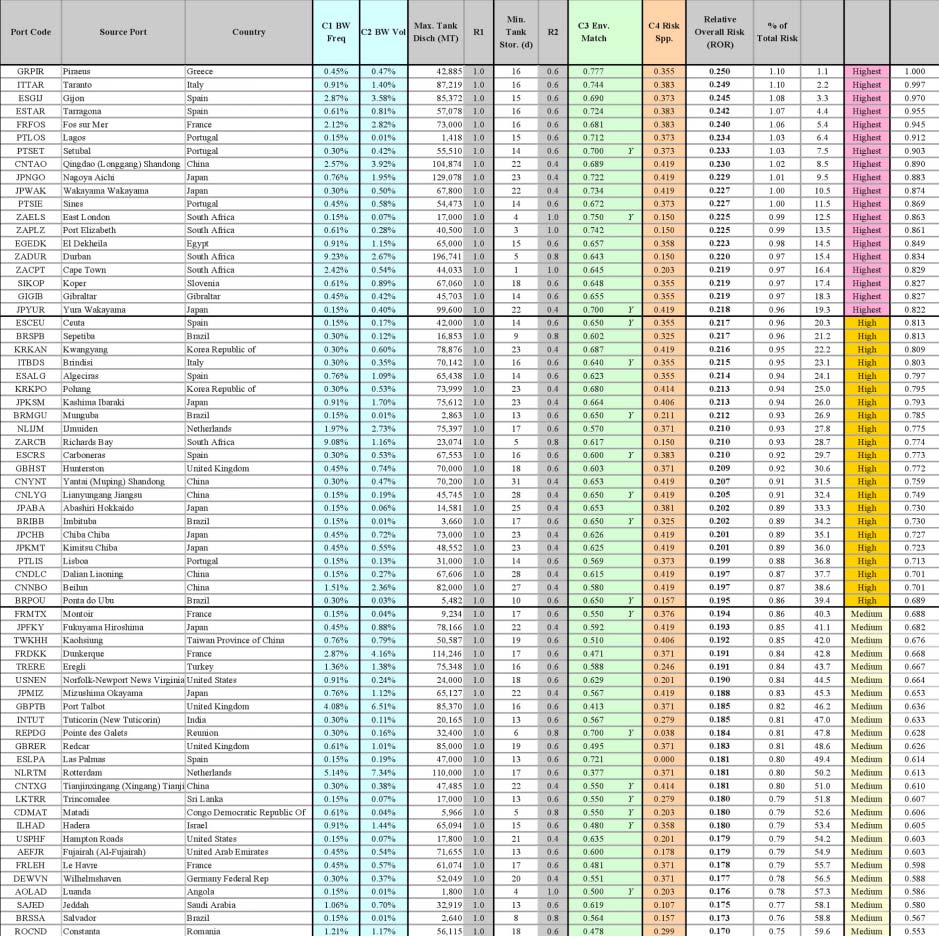
Ballast Water Risk Assessment, Port of Saldanha Bay, Republic of South Africa, November 2003: Final Report
Distribution of Standardised ROR values (S-RORs)
14
12
10
8
6
Frequency
4
2
0
0.00
0.10
0.20
0.30
0.40
0.50
0.60
0.70
0.80
0.90
1.00
S-ROR Value
Figure 25. Frequency distribution of the standardised ROR values for all identified source ports
Table 9. BW source ports reported for the Port of Saldanha Bay, ranked according to their Relative Overall Risk
(ROR)
56
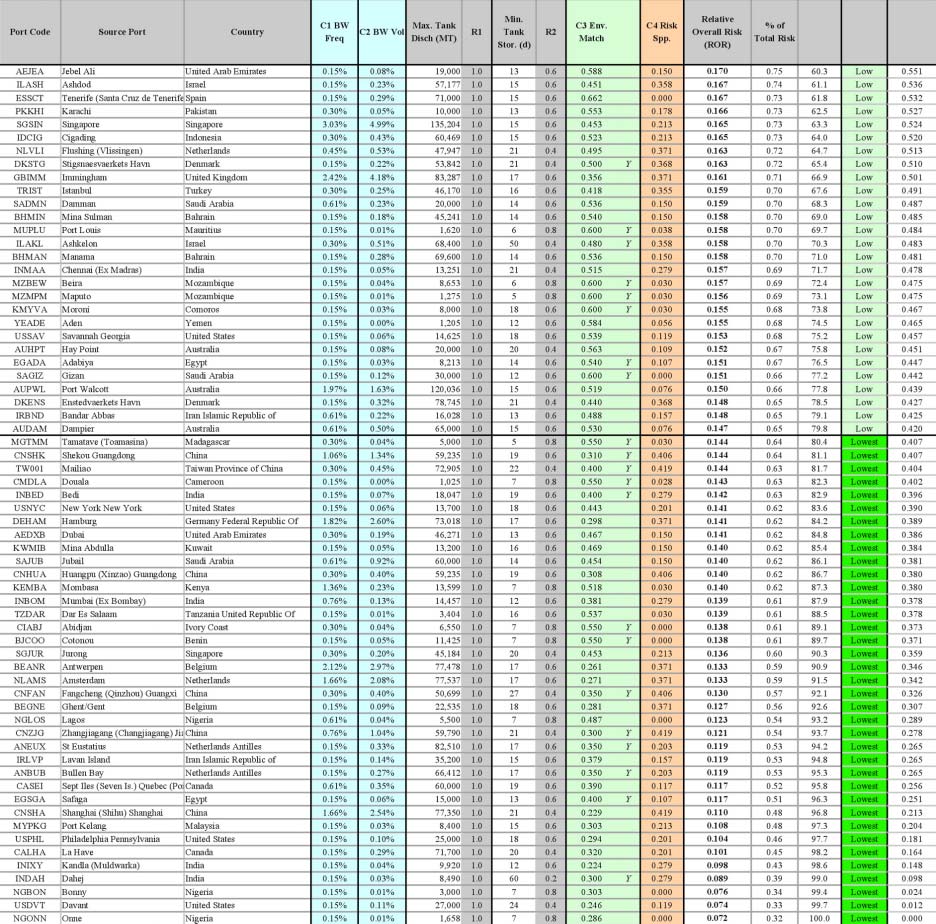
4 Results
Table 9 (cont'd). BW source ports reported for the Port of Saldanha Bay, ranked according to their Relative
Overall Risk (ROR)
4.9 Training and capacity building
The computer hardware and software provided by the GloBallast Programme for the BWRA activity
was successfully installed and is currently maintained at the Marine & Coastal Division of DEAT in
Cape Town. This PC proved reliable and adequate for running the database, undertaking the similarity
analyses, displaying the GIS maps and results and providing other project needs. A copy of the
database is also maintained at the NPA Head office in Johannesburg. BWRFs are continuing to be
collected and stored by NPA offices at Saldanha Bay, with the aim of entering these in large batches,
rather than on a daily basis due to the workload of staff duties and requirements.
The mapping work was conducted on the PC provided for the BWRA project. Both Group A
counterparts had limited previous experience with GIS and ESRI products, so required considerable
initial guidance to master the basic use of ArcView. Both readily grasped the structure and
management of the port map layers and metafiles, but were hindered in obtaining regular practise
between consultants visits by their other duties and locations compared to the location and use of the
57
Ballast Water Risk Assessment, Port of Saldanha Bay, Republic of South Africa, November 2003: Final Report
project PC for other database entries. The Group A and Group C members received advice, training
and guidance from Group B members regarding database BW entries and management, and Group C
counterparts also provided demonstrations of port environment data needs and multivariate
calculations. This helped ensure an adequate interchange of understanding about BWRA system
operation and data management.
All NPA Group B counterparts had previous experience with PCs and Windows applications, so
learned the data entry method and use of the Access database GUIs for editing the records, with little
difficulty. As noted in Section 3.6, the most easily-trained and efficient BWRF database operators are
those with substantial port and maritime work experience, plus previous hands-on experience with
Windows applications. At the outset the Group B leader's understanding was reasonably strong in
both areas and strengthened during the course of the Activity to the point where no further guidance
should be necessary for working with the existing or a new port database. Group B commenced a
record of commonly occurring errors, blanks and data-entry issues as part of the project team's
information gap identifications and to inform members of other Groups. While the number of BWRFs
was limited, the need to sort out and correct database entries that had been made by a student was
educative.
By the second visit Group B plus some members from Groups A and C were proficient in using the
accessory databases for BWRF checking and gap-filling (e.g. Fairplay Ports Guide, the Lloyds Ship
Register and the consultants Excel spreadsheet for estimating BW discharge volumes). In the case of
Group A, both the NPA and DEAT counterparts will need some limited assistance from an ESRI-
familiar person if required to develop a new GIS map for another port, and will be able to provide
useful guidance and important continuity to any future BW or other management projects involving
GIS applications (Section 3.11; Appendix 2).
Group C members were unfamiliar with multivariate analysis but by the end of the consultants second
visit had learned the basic requirements and use of the PRIMER package to conduct the
environmental similarity analysis. All Group C counterparts contributed to the collation and assembly
of port environmental data for important South African ports, as well as becoming competent in
identifying the basic intertidal and subtidal habitat types and boundaries for the GIS Port Map
(Section 3.7).
Group C did not contain any senior marine biologists but had access to their advice and information
via the CFP-A, particularly for the collation of risk species information (Appendix 2). While this
allowed the BWRA Activity to be completed, it raises the risk of a possible loss of continuity with
respect to the database's use of bioregions and the structure and treatment of its risk species data
tables, should the CFP-A not be involved in the future promulgation and use of BWRA activities in
South Africa.
In fact in South Africa the lack of an `active' senior marine scientist Group C from a government
agency, university, research institute or similarly independent organisation (as opposed to relative
junior scientists from contract-oriented consulting agencies such as CSIR), was unique among the
Pilot Country BWRA project teams. In contrast, the NPA provided an excellent level of project
support and counterparts, and comparable to that achieved by port authorities only in two other Pilot
Countries (i.e. Iran and Ukraine).
4.10 Identification of information gaps
Ballast Water Reporting Forms
BWRFs were collected from April 2002 onward, representing the shortest period among the Pilot
Countries, most of which had been collecting BWRFs for a year or more prior to the risk assessment.
While the usage period was short, return rates were high and the level of critical errors or omissions
was low, a feat that can be attributed to the attention and enthusiasm of the senior NPA officer at
58
4 Results
Saldanha Bay, and his ability to obtain a cooperative response from ships' officers. The most common
key omissions in both the BWRFs and NPA vessel visit records (in terms of key records required by
the BWRA) were principally:
· `Next Port of Call' left blank by oil tankers and some bulk carriers using the multipurpose
terminal (probably because the Next Port is frequently unknown until near or after completion
of cargo loading). Since the BWRF is normally completed and submitted soon after arrival,
this is essentially a matter of timing and coordination with the ship, its local agent and/or port
control.
· Lack of entries for BW Source/s and Uptake Date/s.
· Last country of call provided instead of last port of call (correctable for some cases where the
same error had not occurred in the port's shipping records).
The following list summarises other omissions or mistakes that are not uncommon in BWRFs
submitted at other Demonstration Sites:
· No exchange data in the BW exchange field (Part 4 of the BWRF; Appendix 1), or no reason
given for not undertaking an exchange.
· BWRFS showing BW exchange data contained empty BW source cells (it is important to
enter the source port/location details because exchanges are often well below 95% effective
and never 100%).
· Salinity units omitted or else sometimes provided in SG units.
· Water depth provided in the universally confusing sea height field (actually means wave
height).
· BW Discharge field left empty or provided with a small number, even by ships loading a full
or part cargo and therefore having to discharge most if not all of their ballast.
The above lists highlight the items that port officers should immediately check when collecting or
receiving any BWRF. Unless BWRF guidance is provided and errors corrected, ships' officers,
shipping agents and port officers will not become familiar with and effectively use the BWRF
process. Unless BWRFs are completed accurately and fully by visiting vessels, a potentially
significant percentage of BW sources, discharge and uptake volumes will remain unclear for ships
using the Multi-purpose terminal.
Apart from lack of BWRF familiarity, the time provided for a ships' officer to complete a BWRF is
another factor that can influence the number of mistakes and omissions. BWRFs provided to ships
during their berthing or departure phases cannot be expected to receive the same level attention as
forms already onboard the ship and completed prior to arrival. Reporting can be improved if shipping
agents are requested to supply BWRF reminders (and blank forms where necessary) to ships 1-2 days
prior to arrival, or to allow time for BWRF reporting after the ship has berthed and obtained
permission to discharge. The former option will reduce the number of completed Next Port of Call
entries, the latter option prevents use of the collected BWRF as an instrument to help assess BW
discharge permission, and/or tank sampling and monitoring.
Even with correctly completed forms, it is often impossible to identify the ultimate destination of any
BW uplifted by a port that receives and analyses BWRFs (Section 3.5). This is important given the
objective of the GloBallast BWRA to identify the destinations of BW uplifted at each Demonstration
Site. In fact some of the GloBallast BWRA objectives required considerable effort searching and/or
deducing the following information, which is not available from the standard BWRFs:
· Destination Port/s where either BW will be discharged or cargo actually offloaded (not
necessarily the Next Port of Call).
· Berth number/location at the reception port (obtained for each Demonstration Site by
laborious cross-checking with port records);
59
Ballast Water Risk Assessment, Port of Saldanha Bay, Republic of South Africa, November 2003: Final Report
· Deadweight tonnage (DWT). This is very useful for checking claimed BW discharge volumes
(DWTs were eventually obtained for most ships from the Lloyds Ship Register, but this is a
time-consuming task, particularly for ships that had entered a new name, incorrect IMO
number or Call Sign on the BWRF).
It is therefore recommended that the IMO Marine Environment Protection Committee (MEPC) review
the standard BWRF with a view to improving its global application under the new BW convention
(see Section 5).
Port environmental and risk species data
It was particularly difficult to obtain reliable environmental information for many port's waters,
particularly for the seasonal water temperature and salinity averages and extrema. This was true for
ports in developed regions (e.g. North America, Europe and Japan) as it was for less developed areas
or where considerable marine research has been undertaken. It was unclear how many of South
Africa's ports may be exceptions to this general finding.
In the case of risk species distribution and status data, many national and regional data sets remain
incomplete and/or unpublished, and there are none for South Africa. Many web sites that list
introduced species for North American, Caribbean, European, Asian or Australasian regions do not
clearly separate or identify which species are historical introductions (e.g. by the oyster aquaculture,
fisheries, aquarium industry, sailing ship hulls) and which are recent (e.g. by ballast water and/or
modern hull fouling vectors). Many lists do not identify the most likely vector/s of their listed species.
60
5
Conclusions and Recommendations
The main objectives of the BWRA Activity were successfully completed during the course of this
project, which took 15 months (i.e. between the initial briefing in January 2002 and the final
consultants visit in March 2003). The level of port and environmental experience brought to the
project by South African counterparts and contributors from NPA, DEAT, CSIR and the universities,
facilitated effective instruction and familiarisation of the BWRA system, with GIS expertise being the
most limited of its three main components. In addition, NPA members of the team are hoping the
BWRA can be repeated for other South African ports, particularly for the Port of Richards Bay.
If South Africa can develop a more strategic integration of its agencies which have expertise and
complimenting roles in the various maritime, port, ecological and environmental health aspects of
ballast water management, there is no doubt it can maintain a significant role in advancing ballast
water management in the African region. Improved government coordination will allow South Africa
to provide effective assistance, technical advice, guidance and encouragement to other port States in
southern Africa, so that a clearer and more reliable picture can be formed on the role of shipping in
the transfer of unwanted and potentially harmful aquatic species to and within the whole region.
The Regional Strategic Action Plan (SAP) being developed by GloBallast for coordinating BW
management activities in the region provides the best mechanism for replicating the collation analysis
of BWRF data. Important items that will facilitate future BWRA activities in Africa will comprise:
· promotion and dissemination of guidelines and instructions about purpose, value and method
of BWRF reporting to ship's officers, shipping agents and port officers;
· need for more species surveys (PBBSs) such as those ongoing within South Africa and that
planned for the Port of Mombasa (Kenya) by GloBallast;
· improved monitoring to obtain more reliable harbour water temperature and salinity data for
ports in the region;
· development of a regional web-based database capable of exchanging and updating species
and port survey information.
Apart from governments, it would be fruitful to encourage regional organisations, port authorities,
shipping companies and key NGOs in the region to actively support efforts in the above areas.
5.1
Recommendations
· The IMO-style BW Reporting Form should be revised in Section 4 to read `Wave height (m)'
rather than the confusing `sea height';
· To identify the locations where BW is discharged within a port, more useful BWRFs should
include an entry for the berth or terminal name/number (instead of simply `Port' and/or
geographic coordinates, which are often left blank).
· Modifying the "Last Port of Call" field to provide a "Last Three (3) Ports of Call" question
would assist BWRF verification checking and analysis for part-loaded vessels visiting multi-
use terminals.
· To help decipher and interpret poorly written, incomplete or suspect BWRFs, port and
database officers involved in the collation and checking of BWRFs should be given access to
up-to-date copies of the Lloyds Ship Register, the Fairplay Ports Guide, Lloyd's Maritime
Atlas of World Ports or equivalent publications. For any port using the GloBallast BWRA
system, a copy of the world bioregions map should also be provided to the data-entry officers,
so that the bioregion of any new port added to the database can be quickly identified.
· Any port officer whose duties include collecting or receiving BWRFs should be instructed to
check that all relevant fields have been completed in legible script. A short BWRF
61
Ballast Water Risk Assessment, Port of Saldanha Bay, Republic of South Africa, November 2003: Final Report
information kit and training course provided to port officers and local shipping agents could
be developed by the NPA, particularly during the implementation of any future BW
discharge monitoring and risk assessment activity at a port in South Africa or beyond.
· Owing to the large number of possible errors and misinterpretations that can be made with the
existing BWRFs, it must always be remembered that people with a practical maritime
knowledge and good background in port and shipping operations will be far more easier and
cost effective to train for the implementation of BW monitoring and management activities.
5.2
BWRA recommendations and plans by Pilot Country
· It is recommended that IMO-MEPC should review the standard BWRF, with a view to
improving its global application, relevance and user-friendliness under the new BW
convention (see Section 5).
· It is recommended that South Africa implements a mandatory BW reporting system, and that
the NPA, DEAT and SAMSA should collaborate to identify the most effective and cost-
efficient regulatory and administrative mechanisms for managing the system.
· From the experience of the BWRA project at Saldanha Bay, the NPA recognises there will be
a need to include BWRF database management as a task under the responsibilities of the
appropriate NPA personnel. It is recommended that such duties will need to include (a)
periodic BWRF data summaries and reporting to NPA and relevant agencies (including error
analyses and advice), and (b) BWRF system guidance and training to port officers to ensure
ships officers and shipping agents are fully briefed about South Africa's BW reporting
requirements.
· To help expand South Africa's domestic and regional training capabilities, NPA intends to
conduct further BWRAs for its major ports such as Richards Bay and Durban, and to assist
DEAT in offers of assistance and encouragement to other African countries. The NPA will
therefore continue collaborating with marine research institutions, CSIR, DEAT, SAMSA and
local NGOs for:
! obtaining and sharing relevant data and information on (a) port environments (including
seasonal water temperature and salinity ranges and GIS mapping of marine habitats and
resources) and (b) identification and evaluation of aquatic risk species via PBBS; and
! assisting with the development, implementation and management of a user-friendly
BWRF system for collecting reliable deballasting and ballasting information.
· DEAT, NPA and SAMSA will support the GloBallast Programme's Regional Strategic
Action Plan for encouraging and assisting other African countries to execute port baseline
biological surveys and collating port environmental data.
· DEAT, NPA and SAMSA will support the development of a regional database for biological
invasion and port environmental and water quality data, as part of a network of such
databases stemming from the GloBallast Programme. A key task of these databases would be
regular updates of information on introduced species in port areas and their impacts, for
improving risk assessment calculations and invasion predictions.
62
6
Location and maintenance of the BWRA System
The GloBallast BWRA hardware and software packages in South Africa are presently maintained at
the Globallast Programme office in Cape Town, with a copy of the Saldanha Bay database maintained
at the NPA offices in Johannesburg. The following people are currently responsible for maintaining
and updating the following features of the BWRA system in South Africa:
Port resource mapping and GIS display requirements:
Name:
Ms Gail Nxumalo
Organisation:
Marine & Coastal Management Division, Department Environmental Affairs
and Tourism.
Address:
6th Floor, Foretrust Building, Martin Hammerschlag Way, Foreshore,
Cape Town, Republic of South Africa.
Tel:
+27 (0)21 402 3342
Fax:
+27 (0)21 421 5342
Email: gnxumal@mcm.wcape.gov.za
Ballast water reporting form database:
Name:
Ms Leticia Greyling
Organisation:
National Ports Authority
Address:
Room 617 Head Office, 101 De Korte Street, Braamfontein, Johannesburg,
Republic of South Africa
Tel: +27-(0)11-242-4144
Fax:
+27-(0)11-242-4260
Email:
leticiag@npa.com.za
Port environmental and risk species data:
Name:
Ms Leticia Greyling (port environment data)
Organisation:
National Ports Authority of South Africa
Address:
Room 617 Head Office, 101 De Korte Street, Braamfontein, 2000,
Johannesburg, Republic of South Africa
Tel: +27-(0)11-242-4144
Fax:
+27-(0)11-242-4260
Email:
leticiag@npa.co.za
Name:
Mr Adnan Awad (risk species data)
Organisation:
GloBallast South Africa.
Address:
c/o National Botanical Institute, Private Bag X7, Claremont 7735, Republic of
South Africa.
Tel:
+27 (0)21 799 8815
Fax:
+27 (0)21 797-1561
Email: Awad@nbi.ac.za
63
References
Awad A & Jackson, L. 2001. Prevention and Management of Invasive Alien Species: Forging
Cooperation throughout southern Africa. Unpublished regional profile of introduced marine species
contributed to the GISP Regional Resource Directory, prepared by MCM-DEAT, Cape Town.
Carlton, J.T. 1985. Transoceanic and interoceanic dispersal of coastal marine organisms: the biology
of ballast water. Oceanography and Marine Biology Annual Review 23: pp. 313-371.
Carlton, J.T. 1996. Biological invasions and cryptogenic species. Ecology 77: pp. 1653-1655.
Carlton, J.T. 2002. Bioinvasion ecology: assessing impact and scale. In: Invasive aquatic species of
Europe: Distribution, impacts and management. (E Leppäkoski, S Gollasch & S Olenin eds). Kluwer
Academic Publishers, Dordrecht, Netherlands, pp. 7-19..
Cohen, A. & Carlton, J.T. 1995. Non-indigenous aquatic species in a United States estuary: a case
study of the biological invasions of the San Francisco Bay and delta. Report to the US Fish &
Wildlife Service (Washington) and the National Sea Grant College Program Connecticut Sea Grant,
December 1995, 211 pp. (from http://nas.nfreg.gov/sfinvade.htm).
CSIR 2000. Saldanha Bay Water Quality Monitoring Programme, 1999-2000. Unpublished report to
the Saldanha Bay Water Quality Forum by CSIR Environmentek, Stellenbosch, March 2000.
Gollasch S & Griffiths, C. 2001. Case studies of introduced species in South African waters prepared
for the GloBallast project. Unpublished report to Globallast Program by DEAT, Cape Town.
Hilliard, R.W., Hutchings, P.A. & Raaymakers, S. 1997a. Ballast water risk assessment for twelve
Queensland ports:, Stage 4: Review of candidate risk biota. Ecoports Monograph Series No. 13. Ports
Corporation of Queensland, Brisbane.
Hilliard ,R.W., Walker, S., Vogt, F., Belbin, L. & Raaymakers, S. 1997b. Ballast water risk
assessment for twelve Queensland ports, Stage 3B: Environmental similarity analyses. EcoPorts
Monograph Series No. 12. Ports Corporation of Queensland, Brisbane (two volumes).
Kelleher, G., Bleakley, C. & Wells, S. 1995. A Global representative system of marine protected
areas. The World Bank, Washington DC, USA.
Leppäkoski, E., Gollasch, S. & Olenin, S. 2002. Invasive aquatic apecies of Europe: Distribution,
impacts and management. Kluwer Academic Publishers, Dordrecht, Netherlands. 583 pp.
Monteiro, P.M.S. & Largier, J.L. 1999. Thermal stratification in Saldanha Bay (South Africa) and
sub-tidal density driven exchange with the coastal waters of the Benguela upwelling system.
Estuarine Coastal & Shelf Science 49(6): pp. 877-890.
Monteiro, P.M.S., Spolander, B., Brundrit, G.B. & Nelson, G. 1998. Shellfish culture in the Benguela
System: estimates of nitrogen driven new production in Saldanha Bay using two physical models.
Journal of Shellfish Research 17, pp. 3-13.
Williamson, A.T., Bax, N.J., Gonzalez, E. & Geeves, W. 2002. Development of a regional risk
management framework for APEC economies for use in the control and prevention of introduced
marine pests. Final report of APEC Marine Resource Conservation Working Group (MRCWG),
produced by Environment Australia, Canberra. 182 pp.
64
APPENDIX 1
Copy of
IMO Ballast Water Reporting Form
from Resolution A.868(20) Appendix 1
(Can be downloaded from http://globallast.imo.org/guidelines)
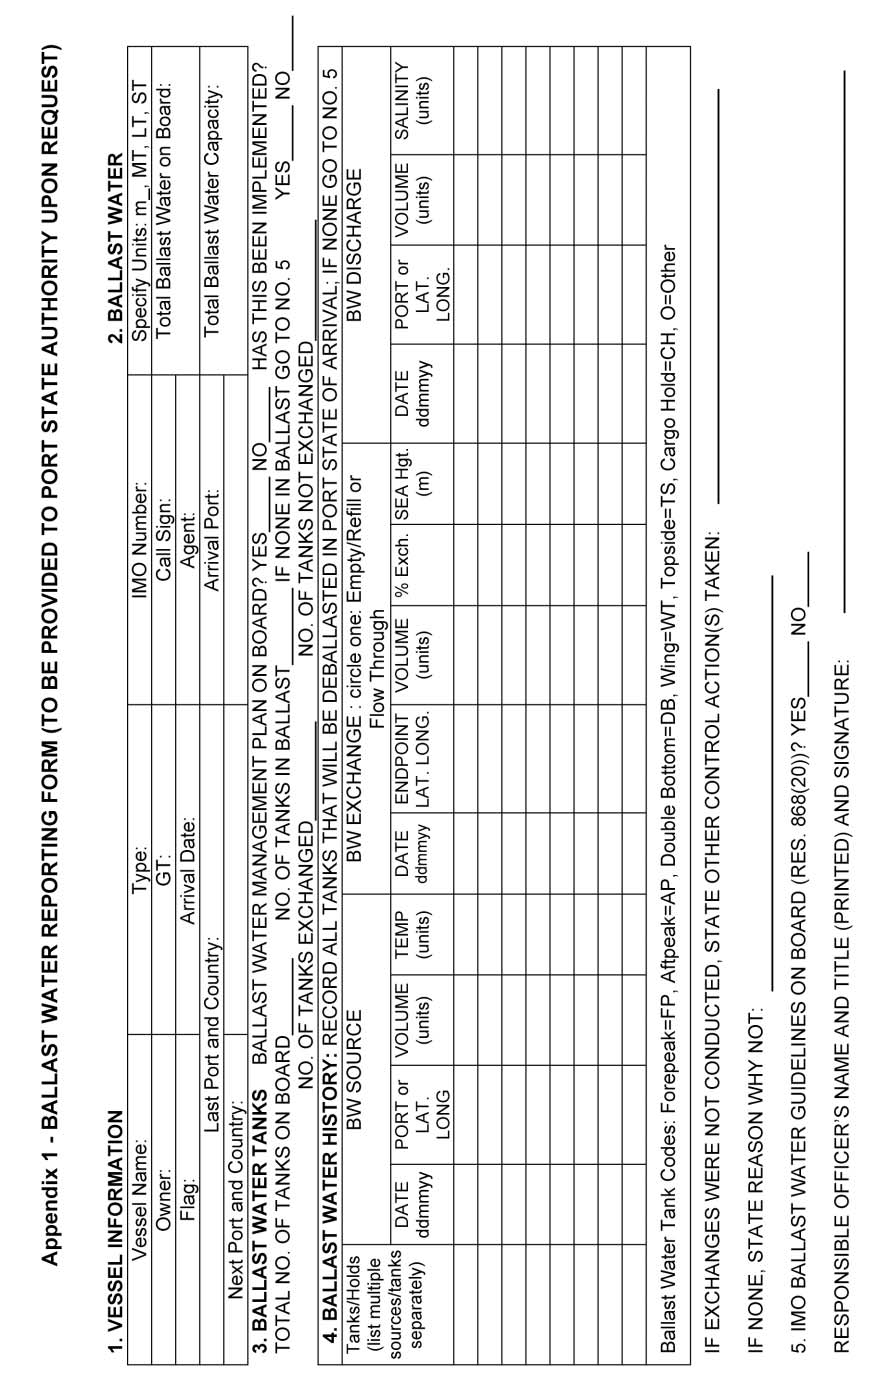
Appendix 1: Copy of IMO Ballast Water Reporting Form
1
APPENDIX 2
Risk Assessment Team for the
Port of Saldanha Bay, South Africa
Appendix 2: Risk Assessment Team for the Port of Saldanha Bay, South Africa
The BWRA team contained three groups which undertook the GIS mapping (Group A), database
development (Group B) and environmental matching/risk species (Group C) components of the
Activity. The activities of the three groups were led by Ms Leticia Greyling (National Ports Authority
of South Africa, Johannesburg) and Dr Rob Hilliard (URS Australia Pty Ltd). Mr Adnan Awad
(Globallast Programme South Africa, Cape Town) provided BWRA project logistical support,
computing equipment and the collation of risk species information for Group C.
Group A (GIS mapping)
Person:
Ms Ashleigh Schoultz
Position:
Group A Leader - GIS cartographer
Organization:
National Ports Authority of South Africa, Durban.
Person:
Mr Chris Clarke
Position:
Group A Counterpart Trainer
Organization: Meridian GIS Pty Ltd
Email: chris@meridian-gis.com.au
Person:
Ms Gail Nxumalo
Position:
Group A GIS cartographer and port map data collation
Organization: Department of Environmental Affairs and Tourism (Marine & Coastal Management
Division), Cape Town.
Email:
gnxumal@mcm.wcape.gov.za
Group B (database BW records)
Person:
Ms Nokuthula Buthelezi
Position:
Group B Leader data entry and correction of BWRF reporting forms
Organization:
National Ports Authority of South Africa, Port of Richards Bay.
Person:
John Polglaze
Position:
Group B Counterpart Trainer
Organization:
URS Australia Pty Ltd
Email:
john_polglaze@urscorp.com
Person:
Mr Lerato Liphoto
Position:
Group B - data entry of NPA ship visit records
Organization: CSIR Environmentek, Stellenbosch.
Email:
lliphoto@csir.co.za
Group C (port environment and risk species data)
Person:
Ms Leticia Greyling
Position:
Group C Leader BWRA calculation and results analysis
Organization:
National Ports Authority of South Africa, Johannesburg.
Email:
leticiag@npa.co.za
Person:
Dr Robert Hilliard
Position:
Group C Counterpart Trainer
Organization:
URS Australia Pty Ltd
Email:
robert_hilliard@urscorp.com.au
1
Ballast Water Risk Assessment, Port of Saldanha Bay, Republic of South Africa, November 2003: Final Report
Person:
Ms Saras Mundree
Position:
Group C collation of port environmental data and multivariate analysis
Organisation:
CSIR Environmentek, Durban.
Email:
smundree@csir.co.za
Person:
Mr Adnan Awad
Position:
Group C collation of risk species data
Organization:
GloBallast Programme Office, South Africa
Email:
Awad@nbict.nbi.ac.za
In addition, Ms Frauke Munster from CSIR Environmentek (Stellenbosch) joined the BWRA team
for the first consultants visit only, and requested to move between the three groups to learn about the
complete BWRA process.
Project Manager
Steve Raaymakers
Programme Coordination Unit
International Maritime Organization
sraaymak@imo.org
http://globallast.imo.org
2
.
APPENDIX 3
Check-list of project requirements
circulated at initial briefings in January 2001
(during 3rd GPTF meeting, Goa)
Appendix 3: Check-list of project requirements circulated at initial briefings in January 2001 (during 3rd GPTF meeting, Goa)
PROJECT REQUIREMENTS AND PROVISIONAL SCHEDULE
REMINDER AND CHECK LIST FOR CFP/CFP-A
(1)
Confirm your availability of adequate PC hardware, + Windows, Access & peripherals
At least one PC with sufficient processor speed, memory, Windows software and peripherals must be
dedicated to the project (plus full-time use during the two visits by the URS Team).
PC Capability: - at least 600 MHz Processor speed
- at least 10 GB of Hard Disk capacity
- at least 128 MB RAM
- 3D Graphics Card with 16 MB of RAM
- x24 speed CD-ROM drive
- 21" 16-bit high-colour Monitor (XVGA or higher)
- a 10/100 base Network Card and 56k modem.
PC Software: OS: at least MS Windows 98 (preferably higher).
MS Access: This database program is usually bundled inside MS Office 97 (Business
Edition), Office Pro; Office 2000; etc. Please check with your IT people if unsure.
MS Word, MS Excel, MS PowerPoint.
PC Peripherals: Convenient access to following peripherals for convenient data inputs and outputs:
- B/W laser printer (>8 pages per minute);
- A3 or A4 colour printer;
- CD Burner
- Flatbed scanner and digitising board
- Semi-auto or auto-archiving system, such as external Zip-Drive, Tape Drive or
LAN servers. This is essential for protecting databases from accidental erasures,
hard drive crashes, system failures, office fire, burglary, etc.
(2)
Identify Your BWRA Project Team (10 people recommended):
Required Pilot Country Counterparts
PCU Consultants
BWRA project team leader
Consultants team leader
PC system and GIS operator (x2)
GIS and database specialist
MS Access database operator (x2)
BWRF and shipping record manager (x2)
Shipping record & port data specialist
Port environmental data searcher (x2)
Environmental similarity analyst (x2)
BWRA specialist
Risk species networker / biologist
NB: when selecting team members, please note training will be conducted in English.
1
Ballast Water Risk Assessment, Port of Saldanha Bay, Republic of South Africa, November 2003: Final Report
(3)
Check all existing Port GIS, Coastal Resource Atlas, Electronic Charts/Digital
Databases [refer to Briefing Paper - GTPF Agenda Item 4 [BWRA Action Required], and the
consultants questionnaire provided at Goa (please complete and return a copy)
(4)
Confirm Dates and Local Arrangements for first consultants visit.
Provisional Dates for 1st Visit (5 working days)
Monday 25 February- Friday 1 March 2002
Odessa, Ukraine
Saturday 2 March- Thursday 7 March 2002
Tehran/Khark Is, I.R. Iran
Monday 11 March- Friday 15 March 2002
Mumbai/Goa, India
Monday 25 March - Friday 29 March 2002
Saldahna, South Africa
Monday 1 April- Friday 5 April 2002
Sepetiba, Brazil
Tuesday 9 April- Saturday 14 April 2002
Dalian, China
Logistics:
Assistance required for visa applications?
Customs clearance required for importation of computer software?
Local transport / work location / office facilities / accommodation
1st Visit Activities:
·
Install and test the ArcView 3.2 GIS package, and the Primer 5 statistical package;
·
Commence GIS training by digitising the port map (from any existing digital files, paper charts,
maps, habitat information, articles, publications, aerial photos, etc);
·
Review all data collated by Country Project Team, including existing databases. Set up the Access
database for ship arrival records and the IMO BWRF. Commence training on the Graphic User
Interfaces for BWRF inputs
·
Collate and review pre-IMO BWRF shipping records to determine source and destination ports,
vessel types and trading patterns.
·
Review available port environmental data and potential sources of same (see Attachment)
·
Commence assembling the risk species list (locate and commence networking with marine
biologists in your country and region).
·
Identify the critical information gaps.
·
Identify the data collating and input work to be completed before the 2nd Visit.
·
Agree on a provisional date for start of 2nd Visit (10 working days).
2nd Visits (10 work days). Complete port map digitising; install bioregional map; complete and add
risk species to database; perform environmental similarity analysis; undertake risk assessment;
evaluate results; review and reporting.
Environmental Data Requirements - see next page, attached.
2
Appendix 3: Check-list of project requirements circulated at initial briefings in January 2001 (during 3rd GPTF meeting, Goa)
ATTACHMENT
TYPES OF ENVIRONMENTAL DATA FOR PORT SIMILARITY ANALYSIS
The project requires two types of port environmental data:
(A) Charts and marine habitat and resources data are required for the GIS Port Map, and
(B) A range of parameters (measured in or near port) for the Environmental Similarity Analysis.
In the case of the quantitative parameters, these include:
·
Mean water temperature during the summer [monsoon] season (oC)
·
Maximum water temperature at the hottest time of the summer [monsoon] season (oC)
·
Mean water temperature during the winter [dry] season (oC)
·
Minimum water temperature at the coldest time of the winter [dry] season (oC)
·
Mean day-time air temperature recorded in summer [monsoon] season (oC)
·
Maximum day-time air temperature recorded in summer [monsoon] season (oC)
·
Mean night-time air temperature recorded in winter [dry] season (oC)
·
Minimum night-time air temperature recorded in winter [dry] season (oC)
·
Mean water salinity during the wettest period of the year (grams/litre; ppt)
·
Lowest water salinity at the wettest time of the year (grams/litre; ppt)
·
Mean water salinity during the driest period of the year (grams/litre; ppt).
·
Highest water salinity at the driest time of the year (grams/litre; ppt).
·
Mean Spring Tidal range (metres)
·
Mean Neap Tide range (metres)
·
Total rainfall in the port's driest 6 months season (millimetres)
·
Total rainfall in the port's wettest 6 months season (millimetres)
·
Number of months accounting for 75% of total annual rainfall (=duration of peak discharges)
·
Number of kilometres from the berths to the nearest river mouth (negative value if upstream)
·
Size of this river's catchment (square kilometres)
[Categorical variables are also required, but these are easy to obtain from charts, maps, articles,
etc]
3
.
APPENDIX 4
Information sources used for collating
Port Environmental Data
Appendix 4: Information sources used for collating Port Environmental Data
Continued over...
1
Ballast Water Risk Assessment, Port of Saldanha Bay, Republic of South Africa, November 2003: Final Report
2
APPENDIX 5
Sources and references of
Risk Species information
Appendix 5: Sources and references of Risk Species information
1
Furlani, D (1996). Guide to Introduced Species, CSIRO Marine Research, Hobart, Tasmania (folder-file
format).
2
McClary DJ & Nelligan RJ, 2001. Alternate Biosecurity Maangement Tools for Vector Threats: Technical
guidelines for Acceptable Hull Cleaning Facilities. Research Report No. ZBS 2000/03, prepared by Kingett
Mitchell & Associates for New Zealand Ministry of Fisheries, September 2001. 29 pp.
2a M. Shaffelke, cited in McClary DJ & Nelligan RJ (2001). [see reference 2]
3
Cohen AN & Carlton JT (1995). Biological study: Non-indigenous aquatic species in a united States
estuary: a case study of the biological invasions of the San Francisco Bay and Delta. US Fisheries &
Wildlife National Sea Grant College Program Report PB96-168525. Springfield Virginia, USA.
http://nas.er.usgs.gov/publications/sfinvade.htm
4
Pollard DA & PA Hutchings (1990a,b). A review of exotic marine organisms introduced to the Australian
region. I. Fishes (a); and II. Invertebrates and Algae (b). Asian Fisheries Science 3: 205-222 (a) and 223-
250 (b).
4a Wallaston 1968 and Wommersley 1981, cited in Pollard D & Hutchings PA (1990). [see reference 4]
4b Skinner & Womersley 1983, cited in Pollard D & Hutchings PA (1990). [see reference 4]
4c Allen (1953) - cited in Pollard D & Hutchings PA (1990). [see reference 4]
5
Australian NIS lists compiled by CSIRO-CRIMP (1997); CCIMPE (2001); SSC/SCFA (2000)[see reference
23]
6
Hutchings PM, Van Der Velde J & S Keable (1989). Baseline survey of the benthic macrofauna of Twofold
Bay, NSW, with a discussion of the marine species introduced into the bay. Proceedings of the Linnaean
Society of New South Wales 110 (4): 339-367.
6a Baker, cited by Hutchings et al (1989). [see reference 6]
7
Australian Coral Reef Society (1993). A Coral Reef Handbook (3rd Edition). Surrey Beatty & Sons Pty Ltd,
Chipping Norton NSW, 264 pp.
8
Coles SL, DeFelice RC, Eldredge LG and JT Carlton (1997) Biodiversity of marine communities in Pearl
Harbor, Oahu, Hawaii with observations on introduced exotic species. Bernice Pauahi Bishop Museum
Technical Report No. 10: 1-76
9
Dakin WJ (1976). Australian Seashores (Australian Natural Science Library Edition). Angus & Robertson,
Sydney, 372 pp.
10 Carlton JT (1985). Transoceanic and Interoceanic Dispersal of Coastal Marine Organisms: The Biology of
Ballast Water. Oceanogr. Mar. Biol. Ann. Rev. 23: 313-371.
11 Boyd S, Poore GCB & RS Wilson (1996). Macrobenthic invertebrates of soft sediments in Port Phillip Bay:
Introduced Species. Unpubl. report to CSIRO-CRIMP by Museum of Victoria, Melbourne, 7-96. 122 pp.
12 Gosliner TM, Behrens DW & Williams GC (1996). Coral Reef Animals of the Indo-Pacific - Animal life from
Africa to Hawaii exclusive of vertebrates. Sea Challengers, Monterey CA, 314 pp.
13 Wells FE & C Bryce (1988). Seashells of Western Australia (Revised Edition). Western Australian
Museum, Perth. 207 pp.
14 Tan LWH & PKL Ng (1988). A guide to the seashore of Singapore. Singapore Science Centre, Singapore,
159 pp.
15 Wells FE & RN Kilburn, 1986. Three temperate-water species of South African gastropods recorded for the
first time in southwestern Australia. Veliger 28(4): 453-456.
16 Gosliner TM (1987). Guide to the nudibranchs (opisthobranch molluscs) of Southern Africa. Sea
Challengers and Jeff Hamann. Monterey.
17 Wasson & Shepherd (1995): cited in Cohen & Carlton (1995) [see reference 3].
18 Middleton MJ (1982). The oriental goby, Acanthogobius flavimanus (Temminck and Schlegel), an
introducedfish in the coastal waters of New South Wales, Australia. J. Fish Biology 21: 513-523.
19 In: Leppäkoski E, Gollasch S. & S Olenin (eds) (2002). Invasive aquatic apecies of Europe: Distribution,
impacts and management. Kluwer Academic Publishers, Dordrecht. 583 pp.
20 Morton, B (1981). Biology and functional morphology of Mytilopsis sallei (Recluz) (Bivalvia: Dreissenacea)
fouling Visakhapatnam Harbour, Andra Pradesh, India. Journal of Molluscan Studies 47: 25-42.
21 Gollasch, S (2002). Importance of ship hull fouling as a vector of species introductions into the North Sea.
Biofouling 18: 105-121.
22 Hass CG & DS Jones (1999). Marine introductions to western Australia, with a focus on crustaceans. In:
Kesby JA, Stanley JM, McLen RF & Olive LJ (eds). Geodiversity: Readings in Australian Geography at the
close of the 20th Century. Special Publication Series No. 6, School of Geography & Oceanography,
University College, Australian Defence Force Academy, Canberra ACT. pp. 37-44.
23 Environment Australia (2000). Joint SCC-SCFA Report of the National Taskforce on the Prevention and
Management of Marine Pest Incursions (October 2000 edition). Environment Australia, Canberra,
Australia.
24 Domingues Rodrigues M & AI Brossi Garcia (1989). New records of Pachygrapsus gracilis (Saussure,
1858) in the Brazilian Littoral. Ciene Cult San Paulo 41: 63-66.
1
Ballast Water Risk Assessment, Port of Saldanha Bay, Republic of South Africa, November 2003: Final Report
25 Dadon JR (1984). Distribution and abundance of Pteropoda: Thecostomata (Gastropoda) in the
Southwestern Atlantic. Physis (Buenos Aires) 42: 25-38.
26 Christeffersen ML (1980). Is Alpheus heterochaelis Say (Crustacea, Decapoda, Alpheidae) found along the
Brazilian coasts? Review Nordestina Biology 3: 236-237.
27 Galil B & C Golani (1990). Two new migrant decapods from the Eastern Mediterranean. Crusteceana 58:
229-236.
28 Hanna GD (1966). Introduced molluscs of western North America. Occasional Papers of Californian
Academy of Science 48: 1-108.
29 Yoloye V (1976). The ecology of the West African Bloody cockle, Anadara (Senilia) senilis (L.). Bulletin of
the Institute Portdam Africique Noire (Series A) 38: 25-56.
30 Jones DS (1992). A review of Australian fouling barnacles. Asian Marine Biology 9: 89-100.
31 Wang JJ & ZG Huang (1993). Fouling polychaetes of Hong Kong and adjacent waters. Asian Marine
Biology 10: 1-12.
32 Arakawa KY (1980). On alien immigration of marine sessile invertebrates into Japanese waters. Marine
Fouling 2: 29-33.
33 Carlton J (1999). Molluscan invasions in marine and estuarine communities. Malacologia 41(2): 439-454.
34 Griffiths CL, Hockey PAR, Van Erkom Shurink C & PJ Le Roux (1992). Marine invasive aliens on South
Africa's shores: implications for community structure and trophic functioning. South African Journal of
Marine Science 12: 713-722.
35 Wang C (1995). Some introduced molluscas [sic] in China. Sinozoologia 12: 181-191 (in Chinese).
36 Cranfield HJ, et al (1998). Adventive marine species in New Zealand. National Institute of Water and Air
Research (NIWA) Technical Report 34, Auckland, New Zealand, 48 pp.
37 Dineen J, 2001. Exotic species reports for Indian River Lagoon, Florida. Smithsonian Fort Pierce website:
http://www.serc.si.edu
38 J Mackie, 2001. Bryozoans at Port of Geraldton, with notes on taxonomy and distribution. In: Geraldton
Port Survey. Unpublished report to Geraldton Port Authority by the Western Australian Museum, Perth,
August 2001.
39 Wonham MJ, Carlton JT, Ruiz GM & LD Smith (2000). Fish and ships: relating dispersal frequency to
success in biological invasions. Marine Biology 136: 1111-1121.
40 NIS data for Angola; supplied by Adnan Adawad (GloBallast Programme, Cape Town, South Africa:
adawad@mcm.wcape.gov.za).
41 Dr Tamara Robertson, University of Cape Town (pers. comm.; August 2002).
42 Gollasch, S. & Griffiths, C (2000). Case studies of introduced species in South African waters prepared for
the GloBallast Programme. Report prepared for Globallast Programme; available from Adnan Adawad
(GloBallast Programme, Cape Town, South Africa: adawad@mcm.wcape.gov.za).
43 Draft provisional species list (9/02) from the Saldanha Bay Port Baseline Biological Survey (supplied by
Adan Adawad (GloBallast Programme, Cape Town, South Africa): adawad@mcm.wcape.gov.za)
44 NIS data for Tanzania; supplied by Adnan Adawad (GloBallast Programme, Cape Town, South Africa:
adawad@mcm.wcape.gov.za).
45 NIS data for Mauritius; supplied by Adnan Adawad (GloBallast Programme, Cape Town, South Africa:
adawad@mcm.wcape.gov.za).
46 NIS data for Mozambique; supplied by Adnan Adawad (GloBallast Programme, Cape Town, South Africa:
adawad@mcm.wcape.gov.za).
47 GloBallast Programme (2002). List of Alien Species. http://www.globallast.org
48 Williamson AT, Bax NJ, Gonzalez E & W Geeves (2002). Development of a regional risk management
framework for APEC economies for use in the control and prevention of introduced marine pests. Final
report of APEC Marine Resource Conservation Working Group, produced by Environment Australia,
Canberra. 182 pp.
49 Walters S, 1996. Ballast water, hull fouling and exotic marine organism introductions via ships - a Victorian
study. Environment Protection Authority of Victoria, Publication 494 (May 1996).
50 Pitcher, G (1998). Harmful algal blooms of the Benguela current. Colour publication available from Sea
Fisheries Research Institute (Private Bag X2, Rogge Bay 8012), Cape Town, Republic of South Africa (20
pp).
51 Benson AJ, Williams JD, Marelli DC, Frischer ME & Danforth JM, 2002. Establishment of the green
mussel, Perna viridis, on the West Coast of Florida. In: Proceedings of 11th International Conference of
Aquatic Invasive species (Feb 25 to March 1, 2002, Washington DC). nvironment Department, US Army
Engineer & Research Development Laboratory, US.
52 Platvoet D, Dick JTA & DW Kelly (2002). Comparative morphometrics of mouthparts and antennae in the
invasive Dikerogammeros villosus and the native Gammarus duebeni (Crustacea, Amphipoda). In:
Proceedings of 11th International Conference of Aquatic Invasive species (Feb 25 to March 1, 2002,
Washington DC). Environment Department, US Army Engineer & Research Development Laboratory, US.
2
Appendix 5: Sources and references of Risk Species information
53 Strong JA (2002). Faunal and habitat comparisons from under and outside canopies of Sargassum
muticum. In: Proceedings of 11th International Conference of Aquatic Invasive species (Feb 25 to March 1,
2002, Washington DC). Hosted by Environment Department, US Army Engineer & Research Development
Laboratory.
54 Verween A (2002). Economic impact of biofouling control of an exotic bivalve, Mytilopsis leucophaeta, in
the harbour of Antwerp, Belgium. In: Proceedings of 11th International Conference of Aquatic Invasive
species (Feb 25 to March 1, 2002, Washington DC). Environment Department, US Army Engineer &
Research Development Laboratory, US.
55 Perry HM, Lukens R, et al, 2002. Invasive species and implications for fisheries sustainability in the Gulf of
Mexico. In: Proceedings of 11th International Conference of Aquatic Invasive species (Feb 25 to March 1,
2002, Washington DC). Environment Department, US Army Engineer & Research Development
Laboratory, US.
56 Makarewicz, JC (2002). Distribution, fecundity, genetics and invasion routes of Cercopafis pengoi
(Ostroumov) - a new exotic zooplankter in the Great Lakes Basin. In: Proceedings of 11th International
Conference of Aquatic Invasive species (Feb 25 to March 1, 2002, Washington DC). Hosted by
Environment Department, US Army Engineer & Research Development Laboratory.
57 Bauer CR & Lamberti GA (2002). Potential interactions between Eurasian Ruffe and Round Gobies in the
Great Lakes: Prey and habitat differences. In: Proceedings of 11th International Conference of Aquatic
Invasive species (Feb 25 to March 1, 2002, Washington DC). Environment Department, US Army Engineer
& Research Development Laboratory. US.
58 Darrigran G et al (2002). Abundance and distribution of golden mussel (Limnoperna fortunei) larvae in a
hydroelectric plant in South America. In: Proceedings of 11th International Conference of Aquatic Invasive
species (Feb 25 to March 1, 2002, Washington DC). Environment Department, US Army Engineer &
Research Development Laboratory, US.
59 Personal communications and manuscripts supplied by Dr Andrea Junqueira, Dr Flavio Fernandes, Dr
Luciano Felicio Fernandes , Dr Luis Proenca during BWRA workshop at FEEMA, Rio de Janeiro (30
August 2002).
60 Fernandes, LF et al (2001). The recently established diatom Coscinodiscus wailesii in Brazilian waters:
taxonomy and distribution. Phycological Research 2001.
61 Paula, A,F (2002). Spatial abundance and distribution of invading coral Tubastraea in Ilha Grande Bay
(RJ) and record of T. tagusensis and T. coccinea in Brazil. M.Sc thesis, State University of Rio de Janeiro,
May 2002.
62 Translated material provided by Assoc Prof. (Biol.) Wang Lijun and Mr Jiang Yuewen (National Marine
Environment Protection & Monitoring Centre, State Administration of Oceanography (Dalian Office), China
(including preliminary lists of identified species sampled by Port Baseline Biological Survey for Dalian
(GloBallast Programme); September 2002).
63 Anil AC, Venkat K, Sawant SS, Dileepkumar M, Dhargalkar VK, Ramaiah N, Harkantra SN & ZA Ansari
(2002). Marine bioinvasions: Concern for ecology and shipping. Current Science 83(3): 214-218.
64 K Satyanarya Rao (2002). Proceedings of 1st R&D Seminar, Global Ballast Water Management
Programme. National Institute of Oceanography, Goa, India. June 2002.
65 National Institute of Oceanography (2001). Report released to mass-media (from Dr AC Anil, NIO, Goa).
66 Xu, CY (1982). Surveys on the causal organisms of red tides in Dalian Bay. Journal of Fisheries, China
6(2): 173-180 (in Chinese).
67 Iizuka S (1976). Succession of red tide organisms in Omura Bay with relation to water pollution. Bulletin of
the Plankton Society of Japan 23(1): 31-43 (in Japanese).
68 Kuriakose PS (1980). Mussels (Genus Perna) of the Indian coast. In: Coastal aquaculture of mussels -
Progress and Prospects. Central Marine Research Fisheries Institute (Cochin, India).
69 Thompson MF (1994). Recent developments in biofouling control. Oxford & IBH Publishing Co, Pty Ltd,
UK.
70 National Institute of Oceanography: Bryozoan Identifications (volume provided by Dr AC Anil, NIO, Goa,
India)
71 Zaitsev Y & B Ozturk (2001). Exotic Species in the Aegean, Marmara, Black, Azov and Caspian Seas.
Publication No.8, Turkish Marine Foundation, Istanbul. Turk Deniz Arastirmalari Vakfi. Istanbul.
72 CIESM Atlas of Introduced Species in Mediterranean Sea (2002). http://www.ciesm.org/atlas
73 McMinn, A (1990). Recent dinoflagellate cyst distribution in eastern Australia. Review of Paleobotany and
Palynology 65: 305-310.
74 Karunasagar I, Gowda HSV, Subburaj M, Venugopal MN & I Karunasagar (1984). Outbreak of paralytic
shellfish poisoning in Mangalore, west coast of India. Current Science 53(5): 247-249.
75 Yoon YH et al (1991). Red tide organisms in the coastal waters of Cheju Island, southern Korea. Bulletin of
Marine Research Institute, Cheju National University 15: 1-14.
76 Pillai CSG & Jasmine S (1991). Life cycle of Perna indica. In: Symposium on tropical marine living
resources, Cochin, Kerala (india), 12-16 January 1988. J. Mar Biol. Association India 33(1-2): 159-165.
3
Ballast Water Risk Assessment, Port of Saldanha Bay, Republic of South Africa, November 2003: Final Report
77 Coles SL, DeFelice RC & LG Eldredge (1999). Nonindigenous marine species introductions in the harbors
of the south and west shores of Oahu, Hawaii. Bishop Museum Technical Report No. 15 (Bernice Pauahi
Bishop Museum, Honolulu, Hawaii).
78 Coles SL, DeFelice RC, Eldredge LG & JT Carlton (1999). Historical and recent introductions of non-
indigenous marine species into Pearl Harbor, Oahu, Hawaiian Islands. Marine Biology 135:147-158.
79 Coles SL, DeFelice RC & D Minton (2001). Marine species survey of Johnston Atoll, Central Pacific
Ocean, June 2000. Bishop Museum Technical Report No. 19 (Bernice Pauahi Bishop Museum, Honolulu,
Hawaii).
80 DeFelice RC, Coles SL, Muir D & LG Eldredge (1998). Investigation of marine communities at Midway
Harbor and adjacent lagoon, Midway Atoll, north western Hawaiian Islands. Bishop Museum Hawaiian
Biological Survey Contribution No. 1998-014 (Bernice Pauahi Bishop Museum, Honolulu, Hawaii).
81 Hewitt C (2002). Distribution and biodiversity of Australian tropical marine bioinvasions. Pacific Science
56(2): 213-222.
82 Coles SL & LG Eldredge (2002). Nonindigenous species introductions on coral reefs: a need for more
information. Pacific Science 56(2): 191-209.
83 Hoedt FE, Choat JH, Collins J & JJ Cruz (2000). Mourilyan Harbour and Abbot Point surveys: Port
baseline surveys for introduced marine pests. Unpubl. report to Ports Corporation of Queensland
(Brisbane). School of Marine Biology & Aquaculture, James Cook University, Townsville
84 Choo PS, 1994. A Review on Red Tide Occurrences in Malaysia. Department of Fisheries, Ministry of
Agriculture, Kuala Lumpur, Malaysia.
85 Southward AJ, Burton RS, Coles SL, Dando PR, DeFelice R, Hoover J, Newman WA, Parnel E,
Yamaguchi (1998). Invasion of Hawaiian inner shores by an Atlantic barnacle. Marine Ecology Progress
Series 165:119-126.
86 Nichols FH, Thompson JK & LE Schemel (1990). Remarkable invasion of San Francisco Bay (California,
USA) by the Asian clam Potamocorbula amurensis. II. Displacement of a former community. Marine
Ecology Progress Series 66: 95-101.
87 Pyne R (1999). The black-striped mussel (Mytilopsis sallei) infestation in Darwin: clean-up strategy. In:
EcoPorts Monograph Series No.19 (77-83). Ports Corporation of Queensland, Brisbane.
88 Culver, CS (2000). Apparent eradication of a locally established introduced marine pest. Biological
Invasions 2 (3): 245-253.
89 Fofonoff PW, Ruiz GM, Hines AH & L McCann (1999). Overview of biological invasions in the Chesapeake
Bay region: summary of impacts on coonservation of biological diversity: a key to the restoration of the
Chesapeake Bay and beyond. Monograph. Maryland Department of Natural Resources, pp.168-180.
90 Veldhuizen TC & S Stanish (1999). Overview of the Life History, Distribution, Abundance, and Impacts of
the Chinese mitten crab, Eriocheir sinensis. Environmental Studies Office, California Department of Water
Resources, Sacramento, CA 95816. March 1999.
91 NTMAG & CSIRO, 2000. Port survey of introduced marine species., Port of Darwin. Unpublished report
provided by Dr Barry Russel, Museum & Art Gallery of the Northern Territory, Darwin, Northern Territory,
Australia.
92 Faunce CH and Lorenz JJ (2000) Reproductive biology of the introduced Mayan cichlid, Cichlasoma
urophthalmus, within an estuarine mangrove habitat of southern Florida. Environmental Biology of Fishes
58: 215225.
93 Zhang F & M Dickman (1999). Mid-ocean exchange of container vessel ballast water. 1: Seasonal factors
affecting the transport of harmful diatoms and dinoflagellates. Marine Ecology Progress Series 176:243-
251.
94 Harris LG & MC Tyrell (2001). Changing Community States in the Gulf of Maine: Synergism Between
Invaders, Overfishing and Climate Change. Biological Invasions 3 (1): 9-21.
95 Crooks JA & CA Jolla (2001). Assessing invader roles within changing ecosystems: historical and
experimental perspectives on an exotic mussel in an urbanized lagoon. Biological Invasions 3 (1): 23-36.
96 In: Raaymakers S (Ed.) (2002). Baltic regional workshop on ballast water management, Tallinn, Estonia.,
22-24 October 2001: Workshop report. GloBallast Monograph Series No.2. IMO, London.
97 Gosling EM (1992). Systematics and geographic distribution of Mytilus. In: Gosling EM (Ed.) The Mussel
Mytilus: Ecology, Physiology, Genetics and Culture. Elsevier Press, Netherlands.
98 In: Raaymakers S & C Gregory (Eds) (2002). 1st East Asia regional workshop on ballast water control and
management, Beijing, China. 31 Oct 2 Nov 2002: Workshop report. GloBallast Monograph Series No.6.
IMO, London.
99 Eno NC, Clark RA & Sanderson WG (Eds). Directory of non-native marine species in British waters.
http://www.jncc.gov.uk/marine/dns/default.htm
100 Oderbrecht et al (2002).
101 Ports & Shipping Organisation (2002). Species tables. In: Draft report of seasonal Port Baseline Biological
Surveys for Port of Khark Island. Unpublished manuscript provided by PSO, Tehran, I.R. Iran.
4
Appendix 5: Sources and references of Risk Species information
102 Introduction to non-indigenous species of the Gulf of Mexico (2002). Website:
http://www.gsmfc.org/nis/nis/Perna_perna.html
103 Erkki Leppäkoski E & S Olenin (2000). Non-native species and rates of spread: Lessons from the brackish
Baltic Sea. Biological Invasions 2 (2):151-163.
104 Ambrogi AO (2000). Biotic invasions in a Mediterranean lagoon. Biological Invasions 2 (2): 165-176
105 Galil BS (2000). A sea under siege alien species in the Mediterranean. Biological Invasions 2 (2):177-
186
106 Mann, R (2000). Invasion of the North American atlantic coast by a large predatory Asian mollusc
Biological Invasions 2(1): 7-22
107 Lohrer AM, Whitlatch RB, Wada K & Y Fukui (2000). Home and away: comparisons of resource utilization
by a marine species in native and invaded habitats. Biological Invasions 2 (1):41-57
108 Wasson, K & B Von Holle (2000). Detecting invasions of marine organisms: Kamptozoan case histories.
Biological Invasions 2(1): 59-74.
109 Rivest BR, Coyer J, Haren AA & S Tyler (1999). The first known invasion of a free-living marine flatworm.
Biological Invasions 1(4): 393-394
110 E x o t i c s p e c i e s l i s t o f t h e M o n t e r e y B a y N a t i o n a l M a r i n e S a n c t u a r y .
http://bonita.mbnms.nos.noaa.gov/sitechar/spex.html
111 F A O d a t a b a s e o n a q u a t i c s p e c i e s i n t r o d u c t i o n s :
http://www.fao.org/waicent/faoinfo/fishery/statist/fisoft/dias/index.htm
112 Global Invasive Species Program (GISP): http://jasper.stanford.edu/GISP/ and GISP Database:
http://www.issg.org/database/welcome/
113 Group on Aquatic Alien Species (GAAS) (Russia): http://www.zin.ru/projects/invasions/index.html
114 Gulf of Maine Ballast Water and Exotic Species Web Sites: http://www.gulfofmaine.org/library/exotic.htm
115 Gulf of Mexico Program Nonindigenous Species Information: http://pelican.gmpo.gov/nonindig.html
116 Smithsonian Environmental Research Center (SERC marine invasions lab): http://invasions.si.edu/
117 Ecological Society of Japan (Ed.) (2002). Handbook of alien species in Japan. (published 9/02).
Chijinchokan Ltd, Tokyo (in Japanese). 390pp. http://www.chijinshokan.co.jp
118 Fine M, Zibrowius H & Y Loya (2001). Oculina patagonica: a non-lessepsian scleractinian coral invading
the Mediterranean Sea. Springer-Verlag (New York):
http://linl.springer-ny.com/link/service/journals/00227/contents/01/00539/
119 Schaffelke B, Murphy N & S Uthicke (2002). Using genetic techniques to investigate the sources of the
invasive alga Caulerpa taxifolia in three new locations in Australia. Mar Poll Bull 44: 204-210.
120 Washington State Sea Grant Program: Non-indigenous aquatic species:
http://www.wsg.washington.edu/outreach/mas/nis/nis.html
121 Baltic Research Network on invasions and introductions (NEMO). Website:
http://www.ku.lt/nemo/mainnemo.htm
122 US Geological Service non-indigenous aquatic species (NIAS) website:
http://nas.er.usgs.gov/
123 National aquatic nuisance species clearing house - Seagrant Program:
http://www.entryway.com/seagrant/
124 Esmaili Sari A, Khodabandeh S, Abtahi B, Sifabadi J & H Arshad (2001). Invasive comb jelly Mnemiopsis
leidyi and the future of the Caspian Sea. Faculty of Natural Resources and Marine Sciences, University of
Tarbiat Modarres. Kor, Mazandaran, IR Iran. ISBN: 964-91086-2-9. (+95 pp; non-English). Obtainable
from: yavarivahid@hotmail.com ; yavari@ir-pso.com .
125 Cohen BF, Heislers S, Parry GD, Asplin MD, Werner GF & JE Restall (2002). Exotic marine pests in the
outer harbour of the Port of Adelaide. Marine and Freshwater Resources Institute of Victoria (Report No.
40), MAFRE, Queenscliffe, Victoria, Australia. (9/02; 86pp.).
5
APPENDIX 6
Name, UN code, coordinates and environmental
parameters of the 357 ports used for the multivariate
similarity analyses for all Demonstration Sites
Appendix 6: Name, UN code, coordinates and environmental parameters
1
Ballast Water Risk Assessment, Port of Saldanha Bay, Republic of South Africa, November 2003: Final Report
2
Appendix 6: Name, UN code, coordinates and environmental parameters
3
Ballast Water Risk Assessment, Port of Saldanha Bay, Republic of South Africa, November 2003: Final Report
4
Appendix 6: Name, UN code, coordinates and environmental parameters
5
Ballast Water Risk Assessment, Port of Saldanha Bay, Republic of South Africa, November 2003: Final Report
6
Appendix 6: Name, UN code, coordinates and environmental parameters
7
Ballast Water Risk Assessment, Port of Saldanha Bay, Republic of South Africa, November 2003: Final Report
8
Appendix 6: Name, UN code, coordinates and environmental parameters
9
Ballast Water Risk Assessment, Port of Saldanha Bay, Republic of South Africa, November 2003: Final Report
10
Appendix 6: Name, UN code, coordinates and environmental parameters
11
Ballast Water Risk Assessment, Port of Saldanha Bay, Republic of South Africa, November 2003: Final Report
12
Appendix 6: Name, UN code, coordinates and environmental parameters
13
Ballast Water Risk Assessment, Port of Saldanha Bay, Republic of South Africa, November 2003: Final Report
14
APPENDIX 7
Consultants' Terms of Reference
Appendix 7: Consultants' Terms of Reference
Consultants' Terms of Reference
Activity 3.1: Ballast Water Risk Assessments
6 Demonstration Sites
1. Introduction & Background
The International Maritime Organization (IMO), with funding provided by the Global Environment
Facility (GEF) through the United Nations Development Programme (UNDP), has initiated the Global
Ballast Water Management Programme (GloBallast).
This programme is aimed at reducing the transfer of harmful marine species in ships' ballast water, by
assisting developing countries to implement existing IMO voluntary guidelines on ballast water
management (IMO Assembly Resolution A.868(20)), and to prepare for the anticipated introduction
of an international legal instrument regulating ballast water management currently being developed by
IMO member countries.
The programme aims to achieve this by providing technical assistance, capacity building and
institutional strengthening to remove barriers to effective ballast water management arrangements in
six initial demonstration sites. These six sites are Sepetiba, Brazil; Dalian, China; Mumbai, India;
Kharg Island, Iran; Saldanha, South Africa and Odessa, Ukraine. The initial demonstration sites are
intended to be representative of the six main developing regions of the world, as defined by GEF.
These are respectively, South America, East Asia, South Asia, Middle East, Africa and Eastern
Europe. As the programme proceeds it is intended to replicate these initial demonstration sites
throughout each region.
2. The Need for the Risk Assessments
The development objectives of the programme are to assist countries to implement the existing IMO
voluntary ballast water management guidelines and to prepare for the introduction of a new
international legal instrument on ballast water.
The current IMO ballast water management guidelines offer states significant flexibility in
determining the nature and extent of their national ballast water management regimes. This flexibility
is warranted given that nations are still experimenting with approaches. A port state may wish to
apply its regime uniformly to all vessels which visit, or it may wish to attempt to assess the relative
risk of vessels to valuable resources and apply the regime selectively to those which are deemed of
highest risk.
The uniform application option offers the advantages of simplified programme administration in that
there are no "judgement calls" to be made or justified by the port state regarding which vessels must
1
Ballast Water Risk Assessment, Port of Saldanha Bay, Republic of South Africa, November 2003: Final Report
participate and which need not. In addition, the system requires substantially less information
management demands. Finally, it offers more protection from unanticipated invaders, and overall
protection is not dependent upon the quality of a decision support system which may not be complete.
The primary disadvantages of this approach are: 1) additional overall cost to vessels which otherwise
might not need to take action, and 2) more vessels will be involved in undertaking the measures, and
therefore the port state will need to monitor compliance from a greater number of vessels.
Some nations are experimenting with systems to allow more selective applicability based upon
voyage-specific risk assessments because this approach offers to reduce the numbers of vessels
subject to ballast water controls and monitoring. The prospect of reducing the numbers of ships to
which the program applies is especially attractive to nations that wish to eliminate introductions of
target organisms such as toxic dinoflagellates. More rigorous measures can be justified on ships
deemed to be of `high risk' if fewer restrictions are placed on low risk vessels. However, this
approach places commensurate information technology and management burdens on port state and its
effectiveness depends on the quality of the information supporting it. The approach may also leave the
country/port vulnerable to unknown risks from non-target organisms.
For countries/ports which choose the selective approach, it will be essential to establish an organized
means of evaluating the potential risk posed by each vessel entering their port, through a Decision
Support System (DSS). Only in this way can they take the most appropriate decision regarding any
required action concerning that vessels' ballast water discharge. The DSS is a management system
that provides a mechanism for assessing all available information relating to individual vessels and
their individual management of ballast water so that, based upon assessed risk, the appropriate course
of action can be taken.
Before a pilot country decides on whether to adopt the `blanket' (i.e. all vessels) approach or to target
specific, identified high risk vessels only, a general, first-past risk assessment needs to be carried out.
This should look at shipping arrival patterns and identify the source ports from which ballast water is
imported. Once these are identified, source port/discharge port environmental comparisons should be
carried out to give a preliminary indication of overall risk. This will greatly assist the port state to
assess which approach to take.
The GloBallast programme, under Activity 3.1; will support these initial , `first-past' risk assessments
as a consultancy on contract to the PCU. This is important for establishing the level and types of risks
of introductions that each port faces, as well as the most sensitive resources and values that might be
threatened. These will differ from site to site, and will determine the types of management responses
that are required.
The PCU risk assessment consultants, in conducting the risk assessment in each pilot country, will
work with and train country counterpart(s) and include them in the study process as part of the
capacity building objectives of the programme, so as to allow each country to undertake its own risk
assessments in future.
3. Scope of the Risk Assessments
A Risk Assessment will be undertaken for each of the ports of:
· Sepetiba, Brazil;
· Dalian, China;
· Mumbai, India;
· Kharg Island, Iran;
· Saldanha, South Africa and
· Odessa, Ukraine.
2
Appendix 7: Consultants' Terms of Reference
The Risk Assessments will apply to all ship movements into and out of these ports based on shipping
data for the last 10 years (or longer if available).
4. Services Required & Tasks to be Undertaken
The GloBallast PCU requires a suitably qualified and experienced consultancy team to undertake the
ballast water risk assessments. The consultancy team will undertake the following Tasks, for each
demonstration site:
Task 1: Resource Mapping
Identify, describe and map on Geographic Information System (GIS) all coastal and marine resources
(biological, social/cultural and commercial) in and around the demonstration site that might be
impacted by introduced marine species.
Task 2: De-ballasting/Ballasting Patterns
Characterise, describe and map (on GIS) de-ballasting and ballasting patterns in and around the ports
including locations, times, frequencies and volumes of ballast water discharges and uptakes.
Task 3: Identify Source Ports
Identify all ports/locations from which ballast water is imported (source ports).
Task 4: Identify Destination Ports
Identify all ports/locations to which ballast water is exported (destination ports).
Task 5: Database - IMO Ballast Water Reporting Form
Establish a database at the nominated in-country agency for the efficient ongoing collection,
management and analysis of the data collected at the demonstration site according to the standard
IMO Ballast Water Reporting Form, and the data referred to under Tasks 2, 3 and 4.
Task 6: Environmental Parameters
Characterise as far as possible from existing data, the physical, chemical and biological environments
for both the demonstration site and each of its source and destination ports.
Task 7: Environmental Similarity Analysis
Using the data from Task 6 and an appropriate multivariate environmental similarity analysis
programme, develop environmental similarity matrices and indices to compare each demonstration
site with each of its source ports and destination ports, as the basis for the risk assessment.
Task 8: High Risk Species
Identify as far as possible from existing data, any high risk species present at the source ports that
might pose a threat of introduction to the demonstration site, and any high risk species present at the
demonstration site that might be exported to a destination port.
3
Ballast Water Risk Assessment, Port of Saldanha Bay, Republic of South Africa, November 2003: Final Report
Task 9: Risk Assessment
For each demonstration site, assess and describe as far as possible, the risk profile for invasive marine
species being both introduced from its set of source ports and exported to its set of destination ports,
and identify the highest risk source and destination ports, using the outputs of Tasks 1 to 8 and based
on the environmental similarity indices developed under Task 7.
Task 10: Training & Capacity Building
While undertaking the risk assessment, provide training and capacity building to the in-country risk
assessment team (up to 10 people) in the risk assessment methodology, including use of database
established under Task 5 and the multivariate environmental similarity analysis programme
established under Task 7.
Task 11: Information Gaps
Identify any information gaps that limit the ability to undertake these Tasks and recommend
management actions to address these gaps.
5. Methods to be Used
The consultants should clearly outline in their Tender how each Task will be achieved. These should
comply with but are not necessarily restricted to the following:
Site Visits:
The consultants will undertake an initial one week (5 working days) visit to each demonstration site to
hold discussions with the CFP, CFP-A, port authority, maritime administration, environment
administration, fisheries/marine resources administration, marine science community and shipping
industry, to identify and obtain information and data for the various Tasks, establish a working
relationship with the in-country risk assessment team, conduct a site familiarisation to the
demonstration site (port) and to identify information gaps.
The consultants will undertake second 8 to 10 working day visit to each demonstration to install the
GIS, database and multivariate environmental similarity analysis programme and to provide training
and capacity building in their use and the overall risk assessment methodology to the in-country risk
assessment team.
Coordination:
The consultants will maintain close consultation and cooperation with the PCU Technical Adviser
(TA), who will manage this consultancy, and with the Country Focal Point (CFP) and CFP Assistant
(CFP-A) in each pilot country, who provide the primary contact point for all in-country activities and
for accessing in-country information and data.
Tasks 1& 2:
This will be restricted existing data only, field surveys are not provided for in the budget. The CFP
and/or CFP-A will compile as much existing information as possible in relation to Tasks 1 and 2 to
provide to the consultants.
The consultants should identify and evaluate any existing in-country databases and GIS for use in
these Tasks. The GIS should be tailored to suit the country's circumstances while ensuring user-
friendliness and consistency across all sites.
4
Appendix 7: Consultants' Terms of Reference
Tasks 3 & 4:
This will be restricted to existing data only. The CFP and/or CFP-A will compile as much existing
information as possible in relation to Tasks 3 and 4 to provide to the consultants. However, the
consultants should identify potential additional sources of data for these two tasks, including records
held by port authorities, shipping agents, customs agencies and similar, that may not have been
identified/compiled by the CFP/CFP-A.
Task 5:
The consultants should identify and evaluate any existing in-country databases for use in this Task.
The database should be tailored to suit the country's circumstances while ensuring user-friendliness,
consistency with the IMO Ballast Water Record Form and consistency across all sites.
Task 6:
This will be based on existing data only. The consultants should clearly outline in their Tender what
parameters will be used, and how the data for these parameters will be collected from the source and
destination ports.
Task 7:
The consultants should clearly outline in their Tender what multivariate environmental similarity
analysis programme will be used, and how it will be used.
Task 8:
The consultants should clearly outline in their Tender how this Task will be achieved, including how
relevant national and international invasive marine species records and databases will be accessed.
Task 9:
The consultants should clearly outline in their Tender how the outputs of Tasks 1 to 8, and in
particular Task 4, will be used to produce the risk profiles for each demonstration site, and what form
these will take.
Task 10 & 11:
The consultants should clearly outline in their Tender how these Tasks will be achieved.
6. Time Frame, End Product and Reporting Procedure
· The risk assessments will be conducted for each of the six demonstration sites in the second
half of 2001 and into the first half of 2002. A detailed workplan and timeline will be
proposed by the consultant in their Tender and the precise timing for each site will be refined
through consultation with each country, once the contract is awarded.
· The end product of this consultancy will be the establishment of the databases, GIS's,
multivariate environmental similarity analysis programmes and risk assessment outputs at
each demonstration site, including training in their use.
· There will also be a report for each demonstration site which addresses as fully as possible all
of the Tasks under section 4, consistent with all parts of these Terms of Reference and the
5
Ballast Water Risk Assessment, Port of Saldanha Bay, Republic of South Africa, November 2003: Final Report
consultancy contract. Results presented should be supported by maps, figures, diagrams and
tables here useful.
· Each report should be submitted to the PCU in draft form first, for review by the PCU and
the demonstration site risk assessment team. The final report for each site will be submitted to
the PCU within one month of the consultants receiving review comments.
· The PCU may arrange for peer review of the draft reports, to ensure scientific credibility and
quality control.
· The final reports should be submitted to the PCU in both hard-copy and electronic form,
including figures, images and data, ready for publication. The PCU will publish each final
report in both English and the main language of the pilot country (if different).
7. Selection Criteria
· Cost effectiveness.
· Demonstrated record of meeting deadlines and completing tasks within budget.
· Extensive experience with the issue of introduced marine species.
· Extensive experience with the issue of ballast water.
· Extensive experience with risk assessment in relation to introduced marine species and ballast
water.
· Demonstrated abilities in literature search and review and in identifying and obtaining reports,
publications, information and data from sometimes obscure and difficult sources.
· Demonstrated skills in information analysis and synthesis.
· Experience in working in developing countries.
· Experience in training and capacity building in developing countries.
· Ability of the proposed methods and workplan to complete all Tasks satisfactorily.
8. Content of Tenders
The Tender should include the following:
· Total lump-sum price in US$D.
· Detailed cost break-down for all Tasks in US$ (NB. Total budget must not exceed US$250,000
and cost-effectiveness and competitiveness within this budget forms a primary selection criteria).
· Detailed workplan and provisional timeline for all Tasks outlined under section 4 above.
· Details of the methods proposed to achieve all Tasks, framed against each Task under section 4
above and consistent with section 5 above.
6
Appendix 7: Consultants' Terms of Reference
· CV's of each consultancy team member (maximum of 3 pages per person) (consultancy teams
should be kept as small as possible).
· Details of the consultancy's professional indemnity and liability insurance and quality assurance
procedures.
Further Information
Steve Raaymakers
Technical Adviser
Programme Coordination Unit
Tel +44 (0)20 7587 3251
Fax +44 (0)20 7587 3261
Email sraaymak@imo.org
7


Ballast W
a
ter Risk Assessment
Global Ballast Water
Management Programme
G L O B A L L A S T M O N O G R A P H S E R I E S N O . 1 3
Port of Saldanha Bay
Ballast Water Risk Assessment
, Republic of South Africa
Port of Saldanha Bay
Republic of South Africa
Final Report
NOVEMBER 2003
Final Report
Adnan Awad, Chris Clarke,
.dwa.uk.com
Leticia Greyling,
Rob Hilliard, John Polglaze
GLOBALLAST MONOGRAPH SERIES NO.13
& Steve Raaymakers
More Information?
el (+44) 020 7928 5888 www
Programme Coordination Unit
Global Ballast Water Management Programme
International Maritime Organization
4 Albert Embankment
London SE1 7SR United Kingdom
Tel: +44 (0)20 7587 3247 or 3251
est & Associates, London. T
Fax: +44 (0)20 7587 3261
Web: http://globallast.imo.org
A cooperative initiative of the Global Environment Facility,
United Nations Development Programme and International Maritime Organization.
Cover designed by Daniel W